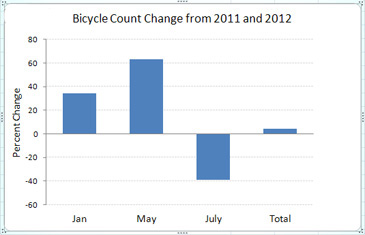
 The number of people biking in Seattle in May 2012 grew a stunning 63 percent over May 2011.
Maybe.
The same count also showed a 40 percent decline in July 2012 compared to July 2011.
SDOT recently released bike count data comparing the beginning of 2012 to data collected in 2011, the first year the city started using a more modern and theoretically accurate method than the previous volunteer-based method.
Overall, adding January, May and July data together, biking appears to have grown 4.7 percent compared to 2011. But I am skeptical of giving these numbers much weight, given the dramatic swings in bike count numbers from month-to-month.
SDOT wrote on their blog that “it will take another year or so of trip counts to make reliable conclusions regarding some of the fluctuations.” The camera-based system is relatively new, so hopefully next year’s results will give us an idea of which data points are outliers, either by freak chance or collection error.
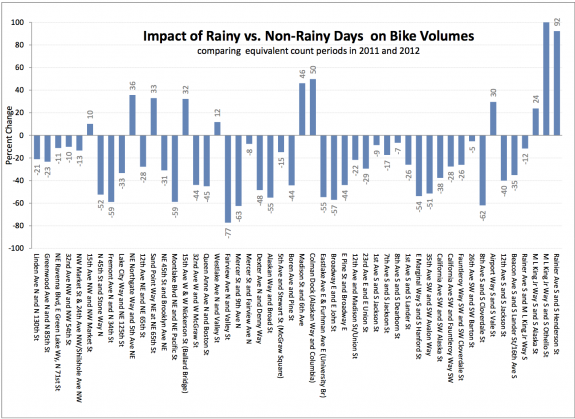
Hopefully, these bike counts and the upcoming Fremont Bridge Bike Counter will provide the city with good data on the effect of weather on bicycling numbers. Weather is often cited as an impediment to cycling, so it would be good to have some solid data on this. You can see SDOT’s analysis of the effect of rainy weather on bike counts. Again, I will probably need to see more data before I know how much weight to give these counts.
SDOT has posted the raw 2012 Citywide Bicycle Count data on the Bicycle Data website. If you’re into that kind of thing, go poke around and see if you can find anything interesting. And, of course, let us know all about it in the comments below!
SDOT now has an analysis of the bicycle count data collected in Seattle for the winter, spring and summer of 2012 that can be compared to data for the same periods in 2011. This data will help planners select the best ways to make it easier to travel in Seattle by bicycle.
According to the counts up to this point, the total number of bike trips in 2012 has increased 4.6 percent compared to the number of bike trips in 2011. (See the chart and tables below.) Other trends are also beginning to emerge, although it will take another year or so of trip counts to make reliable conclusions regarding some of the fluctuations.
So far the data clearly show that weather and large roadway construction projects are major factors that affect the number of bike trips. Also, it appears that fewer trips are taken on a day that is next to a holiday (the day before the 4th of July), apparently because many people are taking vacation and therefore not riding to work.
The number of trips varies greatly from day to day and month to month, and not all of this variation appears to be caused by the weather, construction, or proximity to a holiday. The counts to be taken in the fall of 2012 and the counts that will be made in 2013 will help us learn more about what causes these variations.
Also, a new bicycle counter will be installed in September at the north end of the Fremont Bridge to automatically count passing bicyclists. This will provide data at this location 365 days a year, which will also help planners identify other factors that influence how many trips are made.
The quarterly counts are part of the National Bicycle and Pedestrian Documentation Project. Under this program, a total of approximately 600 counts are taken at 50 locations city-wide once each season. To see the map of count locations, a tabulation of the counts by location and also by weather conditions (dry vs wet) and further information about the bicycle count program, see SDOT’s Bike Data page .


Comments
9 responses to “Biking in Seattle appears to grow, but SDOT bike count results are confusing”
[…] this link: Biking in Seattle appears to grow, but SDOT bike count results are … This entry was posted in Blog Search and tagged bicycling, bridge, city, counter, counts, […]
Interesting. In the short run, factors such as weather will make the data fluctuate, but over time it’ll reveal much. Unlike motoring, I expect different seasonal patterns from cycling. For example, in summer, when school is out, motoring trends to drop off and you might see this in some cycling routes as well, but in others, the nice weather will result in far more cycling. That suggests there will be seasonal changes in when people cycle during the day as well.
Personally, I find their methodology suspect, and I don’t put much stock into this data. Here is what they do: “These counts are conducted quarterly in January, May, July, and September. Each quarter counts are collected for PM peak (5-7pm), off peak (10am-noon), and Saturday (noon -2pm) time periods at each location.” So each location is counted four times a year, or about 1% of the days in a year. Each location is counted for six hours four times a year, or 24 hours out of 8,760 hours in a year, about one-quarter of one percent.
They miss me every time I ride, and I usually ride six days a week. When they put a bike counter at all the key locations and count bike traffic all day, every day, then we will get some meaningful data. That the SDOT puts stock into this small of a sample is alarming.
Well, I’m ok with the methodology. Over enough times, the outliers will come through and we’ll get a good look at bicycling at spots all over the city (whereas the Fremont counter will only tell us about Fremont Bridge traffic).
Assuming they use the same counting process each time, the data should be useful eventually. That’s why I’m confused by the dramatic shifts in the counts this year. Including weather conditions in the data presentation might help.
But they only sample on four days of the year. I can’t see how any conclusions could be drawn from such a small sample. This is why we see such a big swing from July 2012.
That few times a year is far more data than the way we used to do it, and there is a cost associated with increasing it any further. Plus, this counting method is a national standard, so it could theoretically be used to compare to other cities (though I’m not sure how well that would work in practice).
Hopefully, with enough data, the outliers will be apparent. And knowing how rain effects counts is also useful. If we get a good % for how it changes things, we could also maybe adjust counts accordingly…
I guess they’re not collecting this data, or at least not reporting it, but it would be interesting to see a breakdown of the percentage of riders wearing helmets at each timepoint and location. My hypothesis is that commuter bike traffic (i.e., during peak commute times and at peak commute hubs) is much more likely to wear a helmet than, say, Saturday afternoon or “casual exerciser” traffic. These kinds of statistics might be really helpful for any attempt to repeal or amend the helmet law for bike share users.
Helmet data was collected in the old volunteer-run counts. I don’t know if it is included in these, though (good question).
Last I heard, helmet use in Seattle is something like 80 percent, which is super high. But yeah, I don’t know how this breaks down as commuter vs casual users. Or maybe even commuter vs casual trips (some people only wear helmets on long trips, but not to the corner store, etc).
[…] still needed seven volunteers to help with the final volunteer-run citywide bike count. The city is moving to a more modern, camera-based counting system that will provide more data and won’t require big volunteer call-outs (can you imagine if the […]