Biking is good for your health, right? You’ve probably heard it from bike advocates, the Seattle Bicycle Master Plan, the CDC and maybe even your doctor: Bicycling for transportation in Seattle is a healthy choice.
But when University of Washington Prof. Christine Bae had a past graduate student — Andy Hong — travel a loop around the center of the city using a device to measure commute-time pollution exposure, they found air quality can vary dramatically at points along popular bike routes. Biking on NE 45th Street in the U District will expose you to far higher levels of black carbon than biking on the Burke-Gilman Trail, for example.
So the health benefits of cycling might not depend solely on how often you bike, but also on where you bike.
Urban planners have assumed interventions like walkable transit-oriented development and bike networks hold positive health outcomes for communities, but a ten-year study from the MIT Center for Advanced Urbanism shed a ‘not so fast’ warning on the above assumptions, according to The Atlantic Cities.
The article concludes, “a recurring thread throughout the [MIT] report is one of humility: We don’t know as much as we think we do, and there are certainly no silver-bullet design solutions for systemic public health problems.”[1]
As a bike commuter, I simultaneously cough in downtown rush hour traffic and assure myself the physical activity benefits of bicycling far outweigh any harm from pollution exposure. But that’s not just my invincible-twenty-something reaction. Even the 2008 Physical Activity Guidelines for Americans remain ambiguous and almost contradictory on the topic:
“Exposure to air pollution is associated with several adverse health outcomes, including asthma attacks and abnormal heart rhythms. People who can modify the location or time of exercise may wish to reduce these risks by exercising away from heavy traffic and industrial sites, especially during rush hour or times when pollution is known to be high. However, current evidence indicates that the benefits of being active, even in polluted air, outweigh the risk of being inactive.”[2] (Chapter 6: Safe and Active, emphasis added)
Despite this claim — one that isn’t necessarily evidence-based — the research behind the risk tradeoff between physical activity and air pollution exposure is inconclusive, and it doesn’t always fall in the favor of the bicyclist.
So can Seattle bicyclists breathe easy? That may depend on where in the city you bike.
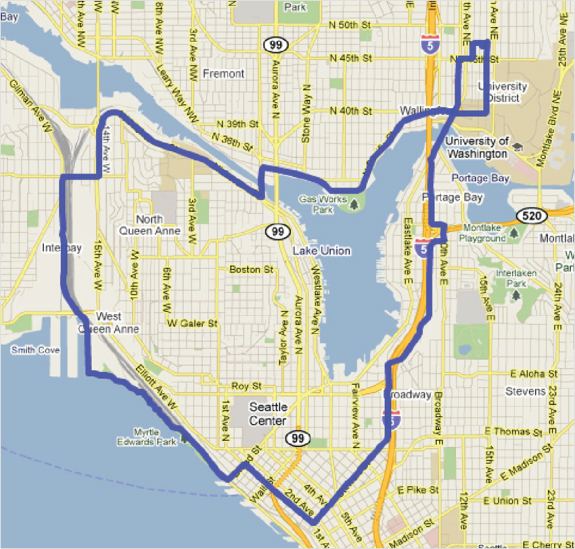
The Transportation Research Board study I introduced above, Exposure of Bicyclists to Air Pollution in Seattle, Washington,[3] measured bicyclists’ air pollution exposure on Seattle streets, specifically looking at black carbon concentrations, a carcinogenic diesel byproduct. Between June and September of 2010, the researchers used a mobile monitoring device on a bicyclist to measure black carbon exposure during peak morning and evening commute hours. The 12-mile route in the study covered the Fremont bridge, the Burke-Gilman Trail, the University District, Lakeview Boulevard adjacent to I-5, the downtown core, Elliott Bay and Interbay, reflecting a mix of traffic volumes, bike facility types and land uses. The route is reproduced in Figure 1 below.

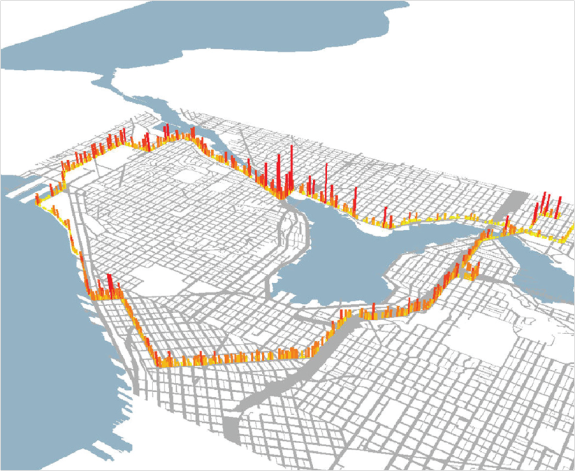
Areas of high traffic congestion, especially those requiring frequent stops, topped the list for the worst exposure. These “hot spots” include intersections on both sides of the Fremont bridge and N 45th Street through the University District. In fact, these areas experienced higher concentrations of black carbon compared to Lakeview Boulevard adjacent to I-5, where vertical separation from the freeway mitigates adverse exposure.
Exposure also peaked around Broad Street near Seattle Center, likely from frequent freight traffic, and in Interbay from idling trains and industrial land uses. These peaks are visible in the 3-D pollution map reproduced in Figure 2 below.

Contrary to other research on the topic, traffic volumes didn’t always predict pollution exposure. Traveling on a bike path did. When compared to on-street riding, bike paths, including the Burke-Gilman Trail and the Elliott Bay Trail, proved to be the best predictor of lower black carbon concentrations. However, black carbon exposure did peak on the section of the Elliott Bay Trail that runs through the Interbay train yard.
Cities promoting bicycling for transportation can increase bicyclists’ exposure to local level traffic emissions, the study concluded.
What do we know? Traffic emissions are harmful to your health. Air pollution causes coughing, wheezing, heart rate variability and lung inflammation; and in the long-term it increases a person’s risk of lung cancer, stroke, heart attack, asthma and birth defects (among other complications). But living a physically active lifestyle is beneficial to your health. Regular physical activity reduces your risk of chronic disease and dying prematurely.
We also know exposure varies based on the concentration of pollutants, the duration of exposure and one’s ventilation rate; which more than doubles during exercise, making people traveling on bikes particularly vulnerable.
How do we minimize the risk tradeoff? For one, better infrastructure. According to a Canadian study linking bicycling in traffic to heart health risk, a bicyclist’s proximity to tailpipes is a primary factor in heightened pollution exposure. Separating people on bikes from car traffic through protected bike lanes and bike boxes at intersections not only increases safety, but significantly reduces exposure to traffic emissions. In Portland, researchers found a protected bike lane physically separated from traffic by a row of parked cars experienced significantly lower concentrations of ultra-fine particulate matter compared to a traditional bike lane.[4]
We can also equip riders with the tools they need to make informed decisions about their health. For example, CycleVancouver’s route planner offers a “Least Traffic Pollution” preference setting when mapping a route.
As bicycling moves to be more inclusive, we can’t ignore that elderly populations and children are more sensitive to health complications from air pollution exposure. Environmental justice research, including research in urban King County, has shown that low-income, minority neighborhoods are often the most adversely affected by air pollution.
Of the world’s 19 top risk factors for mortality, physical inactivity ranks as the fourth highest,[5] while urban outdoor air pollution trails down at fourteenth. As an individual commuter, I like those odds. But it’s something to consider when choosing your route or planning for a bike-friendly city: Will the breathing be easy?
[1] Badger, E. (2013, December 17). We Don’t Know Nearly As Much About the Link Between Public Health and Urban Planning As We Think We Do. The Atlantic Cities. Retrieved January 21, 2014, from http://www.theatlanticcities.com/neighborhoods/2013/12/much-what-we-know-about-public-health-and-urban-planning-wrong/7886/
[2] 2008 Physical Activity Guidelines for Americans. (2013, March 11). Department of Health and Human Services. Retrieved February 1, 2014, from http://www.health.gov/paguidelines/guidelines/
[3] Hong, E. A., & Bae, B. C. (2012). Exposure of Bicyclists to Air Pollution in Seattle, Washington. Transportation Research Record: Jounrnal of the Transportation Research Board, No. 2270, 59-66. Retrieved January 15, 2014, from http://trid.trb.org/view.aspx?id=1130099
[4] Kendrick, C. et al. Impact of Bicycle Lane Characteristics on Exposure of Bicyclists to Traffic-Related Particulate Matter. Transportation Research Record: Journal of the Transportation Research Board, No. 2247, 24-32. Retrieved February 18, 2014 from http://web.cecs.pdx.edu/~maf/Journals/2011_Impact_of_Bicycle_Lane_Characteristics_on_Exposure_of_Bicyclists_to_Traffic-Related_Particulate_Matter.pdf
[5] WHO. (2009). Global Health Risks: Mortality and the burden of disease attributed to selected major risks. Retrieved February 8, 2014 from http://www.who.int/healthinfo/global_burden_disease/GlobalHealthRisks_report_full.pdf


Comments
24 responses to “Some Seattle bike routes have healthier air than others”
Thanks for the great story, Ryann!
As a West Seattle commuter I brought this up with my doctor years ago about all the diesel smoke from terminal truck traffic. His suggestion was any health impacts of pollution, even focused were completely diffused by riding vs not riding. He also thought a london style particulate mask was foolish. http://respro.com/pollution-masks
Also if pollution freaks you out, never research the dust from brake and clutch linings (asbestos is still used even today), or test the soil near a road.
This is great data and an interesting article but I wish the study had included a greater diversity of locations. Too often I find the “cycling in Seattle” equals “cycling from north of the ship canal to downtown and back”.
Still, I like hearing that even a row of parked cars can make a big difference. I’m going to start hauling a little one in a trailer behind me soon and little lungs are more sensitive to this stuff than mine (especially because there is no exercise involved in riding in that trailer).
Like all studies, more can be done. I can’t speak for the researchers, but it seems they chose a route that would travel on different types of facilities, streets with different traffic levels and areas with different land uses. Plus, it was based out of uw, so makes sense to start there :-)
I think if you bike often and starting coughing at particular places, you know that you are being subjected to air toxics and particulates enough to affect you. I have been using a Filt-R commuter mask since last winter and I’m very pleased with it, particularly passing next to the many digging sites in South Lake Union right now.
The solution for the biggest, most entrenched urban cores isn’t to move bike and pedestrian routes, but to move car routes (as is seen in great urban cores the world over). To say, “This place, where millions of people come together, ought to be a place they come together in health.” And in a growing city like Seattle we have to think about where we build new residences, commerce, and retail in relation to access on foot, bike, transit, and car, and in relation to pollution and freight routes.
When people make a big deal about the potential locations of light rail stations north of Northgate, this is a related concern. 130th, 145th, 155th, all with similar current land use, all which would prompt similar kinds of changes in the bus network, but with vastly different prospects for access on foot and bike.
Another thing this brings to mind is the old Soviet practice of planning cities with industrial zones downriver (and maybe downwind) from residential areas. The great tragedy of American zoning is that it allows so little outside of the most dangerous and polluted roads. The faulty conceptual basis of our zoning policy, along with its long physical legacy, is the reason that health and walkability are such a contradiction in America today. We’ll only change it with a fundamental change in our conception of the city and the way we regulate land use and building.
I always figured that if I was driving a car I would be breathing the same air is if I was driving a bike on the same road. But the pollution is plainly evident when I compare driving in on 15th and driving in on the Elliott Bay trail, even with the trains.
Kirk, some studies have found that exposure to traffic emissions for drivers and bus riders is similar if not higher than a bicyclist’s level of exposure. Again, the reseach is pretty inconclusive on the issue (and there’s not a lot done on it) and there are still the variables of the duration of exposure and a person’s ventilation rate. People traveling by bike and on foot actually have the advantage in this because they can more easily choose alternative routes that separate us from traffic, such as cutting through a park or taking an off-road trail if these are available.
There was a scientific paper some time ago showing just this to be true — that, actually, the concentration of pollution is greater in the center of the road than on its margins, so that cyclists tend to breathe slightly cleaner air. The difference when biking is that you’re breathing more heavily and usually moving slower. So though you probably breathe slightly cleaner air in the I-90 floating bridge bike path compared to in the general traffic lanes (though this will be diminished when WSDOT guts the north-side shoulder to add bi-directional HOV lanes) you breathe much more of it.
” you probably breathe slightly cleaner air in the I-90 floating bridge bike path compared to in the general traffic lanes ”
That depends on the wind direction and velocity. If the wind is blowing from the North, or strongly the ppm is going to be way lower than from the South, or not at all. (althougth the traffic itself creats a bit of wind from E to W in the West bound lanes.)
Mostly what I notice is the amount of grit on my clothes and bike from riding along I-90 when it’s raining.
These TOTOBOBO masks work great, and are designed to be comfortable when exercising. It’s telling to see the filters start to turn black after a few rides.
“These ‘hot spots’ include the wide intersection on the west side of the Fremont bridge and N 45th Street through the University District.”
The Fremont bridge is a North-South route. What is meant meant by the intersection on the “west side” of the bride. This is not intended to be a snarky comment. I live near the bridge on the South (Queen Anne) side. Is the South Side worse than the North?
I’ve clarified that sentence. Looking at the map, there are significant spikes on both sides of the bridge (sorry).
The hot spot is referring to the intersection of Nickerson Street, 4th Avenue N and Westlake Avenue N on the Queen Anne side of the bridge.
I’m actually quite surprised that the numbers were comparatively good for biking adjacent to I-5 on Lakeview. That makes me feel a tiny bit better about biking across I-5 twice a day every day.
The data also helps make the case for converting the Fremont Bridge to walk/bike/transit only and building a car bridge at 3rd Ave W. :)
Since even a few feet can make a meaningful difference in microparticulate levels, would it not make sense to standardize exhaust to the left, especially on the diesels that generate this soot?
I wonder if it would be possible to have electric hybrid modes for the vehicles that dump out the most toxic fumes downtown.
If I recall correctly, we used to have hybrid buses that switched to overhead wires when they entered the bus tunnel.
Counterintuitive finding: when breathing diesel fumes, you may be better off going harder.
http://www.theglobeandmail.com/life/health-and-fitness/fitness/dirty-air-affecting-your-health-pedal-harder/article15212543/
Thanks for sharing that! Very interesting!
Thanks for this post! I wouldn’t have ever thought about pollution on the trail through Interbay before. Makes sense with all those diesel engines idling there, especially since it is sort of a little valley between Queen Anne and Magnolia. It’s probably significantly worse there on still (no wind) days. I used to ride through there quite frequently and when I get the chance I’ll still often detour through there when I’m in the area.
Excellent post! This issue needs much more exposure, and this is a great first step. The research presented is interesting but the reminder that very little research exists is equally interesting.
Air quality issues near arterials is just one more reason why Greenways — while not a one-size-fits-all solution for every part of Seattle — are badly needed.
This is also a stark reminder that cars and trucks currently DO NOT pay their fair share. Air pollution is a classic example of an economic negative externality. As more people move to cities, more research is needed and more solutions need development.
Great article. What the map also shows is that if you drive, you subject yourself and your passengers, to bad air quality.
And the Environmental Protection Agency lists poor indoor air quality as the fourth largest environmental threat to our country.
So, worrying about the dangers of air pollution while riding a bicycle seems pretty low priority from a healthy living standpoint.
[…] to support neighborhood greenways–healthy air when you walk and bike! UW professors create a compelling graphic of where to bike if you want to breathe healthy […]
[…] a February report for Seattle Bike Blog by Ryann Child, we told you about a UW study where researchers biked a black carbon measuring device in a loop […]