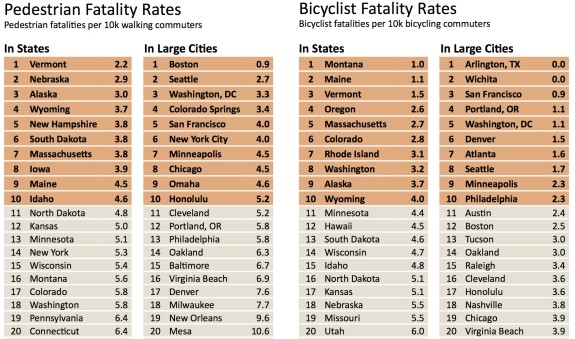
As you sprint across a highway-style four-lane street through the heart of your neighborhood, it’s probably hard to believe that Seattle may be the second safest big city in the US for people walking and biking. But that’s what the data suggests, according to the 2014 Alliance for Biking & Walking Benchmarking report and the Seattle Times’ Gene Balk.
When walking and biking commute rates per capita are compared to reported fatalities, Seattle places second in walking safety and eighth in biking safety. In fact, Seattle is one of only four cities that makes the top-ten list for both biking and walking safety. When Balk combined the two measures, he determined that Seattle places second overall. Only Boston is safer.
First, some caveats to the data: Because the walking and biking rate information comes from Census surveys, people who mix walking or biking with public transit are likely not counted in the walking and biking columns. Neither are people who walk or bike to work some days, but not always. And, of course, only work trips are counted. So a retired person walking to the grocery store would not be counted, either.
The way the Census question is asked, the data represents the mode of transportation people use for most of their commute trips “last week.” So all those people pouring into a New York subway probably don’t count in the walk column. Neither do all the people walking to a 3rd Ave bus stop in downtown Seattle. But the Census data is probably the closest estimate we have, and it’s definitely the only one that’s universal between cities.
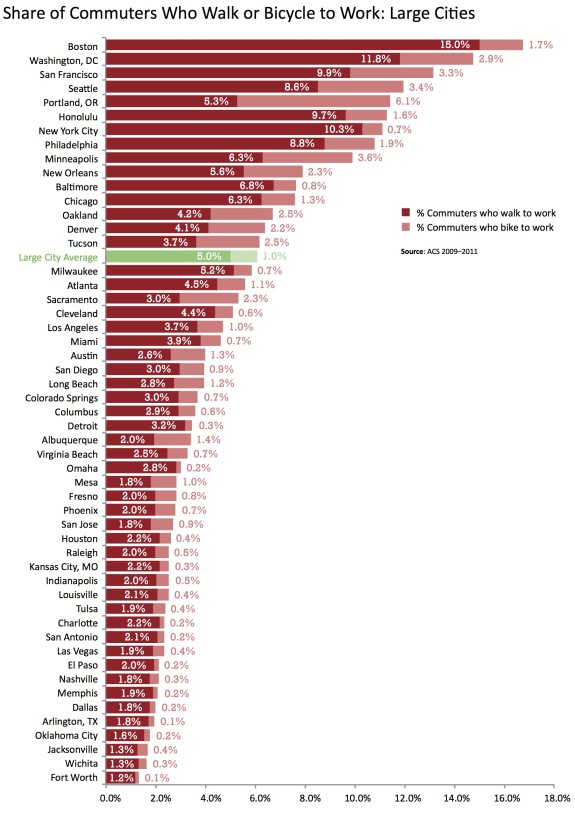
When added together, Seattle has the fourth-highest walk/bike commute rate among large US cities. Yes, Seattle even ranks higher than Portland, which has a higher bike rate but a lower walk rate. As we reported previously, when you include all commute modes measured by the Census, Seattle is one of only five large cities where fewer than half of residents drive alone to work.
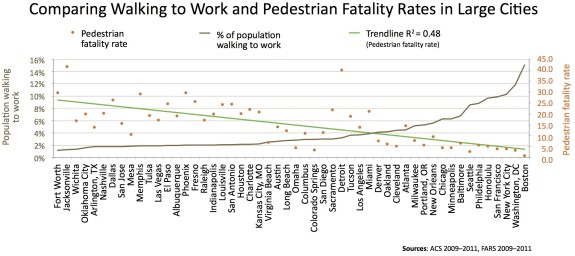
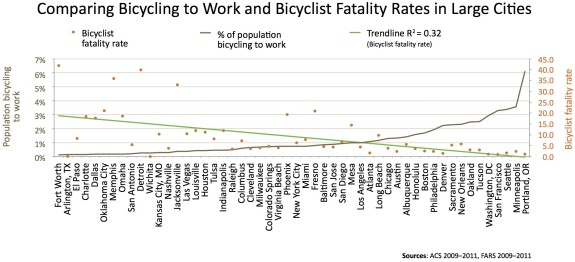
 The most clear link to safety is the walking and biking rate in a city. The more people walk and bike, the safer walking and biking is for everyone. In fact, if you look at visualizations comparing bike/walk rates to safety, you can almost see the path to Vision Zero in which nobody dies in traffic:

 Balk explains the safety in numbers effect this way:
In four of the five cities with the lowest fatality rates — including Seattle — the percentage of people who walk or bike to work is among the highest in the nation. In Seattle, nearly one out of every eight workers is either a pedestrian or bicycle commuter; the 52-city average is just one out of every 20 workers.
The outlier is Colorado Springs, which has the fourth-lowest fatality rate, but also a relatively low level of pedestrian and bike commuting.
In all of the deadliest cities, there are very few pedestrians and very few cyclists. In Jacksonville, Fla., which has the highest fatality rate, less than 2 percent of people walk or bike to work.
And the fatality numbers are striking: in Jacksonville, pedestrians are killed at a rate 15 times higher, and cyclists 19 times higher, than in Seattle.
But as Balk writes, “While Seattle’s stats may be envious, more can be done to improve pedestrian and cyclist safety here.” This safety data probably does little to ease the heartache and immense loss felt by friends and family of Sandhya Khadka or Darren Fouquette or any of other people who have lost their lives while walking or biking on Seattle streets. In fact, it’s a bit depressing that the bar for walking and biking safety is so low in the United States that Seattle stands out as a leader.
The city has done a lot of smart things to its streets throughout the years to help lead to this safety rate, and there are a lot of smart plans rolling out at this moment. But the city is not moving fast enough. One death is too many, and the number of people seriously injured in traffic is much, much higher than the number who die. Until the city invests heavily in prioritizing walking, biking and ADA projects (and, of course, driving safety projects), Seattle will not eradicate the scourge of traffic violence.
It may take less work to get from Jacksonville to Seattle than to get from Seattle to Vision Zero. But it is work we must do.


Comments
19 responses to “Times: Seattle is second safest big US city for walking and biking”
Thanks Gene and all the folks at the Alliance. Safety in numbers is where it’s at, looks like.
I would love to see this kind of analysis with some additional data: some measure of how aggressively local law enforcement and prosecutors act on vehicular crime, vehicular crime/misdemeanor rates/overall aggression (such as moving violations per person, etc.) and comparative data for cities in other countries that perform both better and worse than the U.S. cities. (I believe the former is really what is missing from the League’s Bicycle Friendly America measure, though I realize coming up with a good measure of vehicular aggression is challenging ). Seeing those comparisons would yield more insight beyond the safety in numbers intuition that this shows.
Boston shouldn’t be #1 for safety, with its icy roads and sidewalks (I’ve slipped and fallen *so* many times there), super-aggressive drivers (“massholes” is a source of pride), lack of vehicle law-enforcement*, lack of vulnerable user laws, and unaware pedestrians who jaywalk as a rule.
And yet it is, because Boston’s built environment slows cars down. Windy, narrow streets. Potholes. Streets lacking street signs (one learns to navigate by counting streets; “turn left at the third street past the arterial”). One-ways and dead-ends. A critical mass of somewhat inexperienced pedestrians (college students) who will walk out in front of your car without any warning (often due to limited sightlines), combined with terrible signals that encourage you to not bother waiting for permission to walk. Basically, driving in Boston is a nightmare, and cars go slow to compensate.
Protected bike lanes, sidewalks, etc are all wonderful (and importantly, COMFORTABLE), but when it comes to pure safety, the #1 thing is to slow cars down. Road diets, lowered speed limits, traffic circles, narrowed roads, speed humps/raised crosswalks, chicanes, and a critical mass of pedestrians/bicycles are the most effective thing we can be doing to make the roads safer for _everyone_, in my opinion.
* Boston/Cambridge/Somerville PD happily ticket people for jaywalking, running stop signs/lights on a bike, while ignoring automobiles that are blatantly breaking the law. Anecdotally, when I was right-hooked in a bike lane, the officer on the scene put in the report that I was wearing dark clothing (I was wearing normal clothing, it was light out, _and_ I had a rear blinky light on). They found no fault with the driver who turned right into me.
It’s always interesting to see the Census data, but I prefer the actual state and city counts. As well as the loop counters for actually figuring out who and where people are riding/walking.
What people say and what they actually do are often two different things.
As for safety, we are lucky that arterial speed limits by default are 35, with side streets at 25, with narrow streets and lots of on street parking making drivers often drive slower than 20mph. As was mentioned in an earlier comment, it’s the relative closing speed that makes all the difference. As well as the hit speed. Just watching those British Ad’s to slow down shows clearly the issue:
Minor nitpick – arterial speed default is 30mph, not 35mph. http://www.seattle.gov/besupersafe/rules.htm
That may be, and it is good, but it seems like most of the arterials are signed at 35mph, (with folks driving 35+mph)
There are a lot of streets w/ 35mph limits. The city’s strategy is usually not to sign arterial streets that are 30 (the default). I’ve often wondered what effect this has on behavior (vs if there were 30 mph signs all over the place). I honestly don’t know.
I like how the residential street speed limits work the opposite way: They are 25 if there is no sign, but streets with 20 mph limits have signs noting it.
Yes, and that’s a problem. There’s no need for speeds that high on our arterial streets.
Complete streets investments are vital because they not only create space for people on foot, bike and for those with mobility issues, but they also make sure people driving on a speed limit 30 street also choose to drive no faster than 30. If a reasonable, average person feels perfectly comfortable going 5-10 over the limit, then there’s a serious problem with the street design.
While Complete Streets *can* provide lower design speeds for cars, that’s not how they’re always implemented.
The highway-design mentality is hard to break, and given the budget, many engineers will produce plans for overdesigned streets with multiple layers of countermeasures to segregate and protect pedestrians and bikes, rather than take lowered motorist speed as a desirable part of city traffic.
We need to tackle design speed head-on, through design standards for urban travel lanes, rather than relying on pedestrian and bicycle facilities as incidental impediments to high-speed driving.
I don’t believe these statistics are very accurate. I don’t walk much, but I think Portland is way better than Seattle for bicycling, not just a little better. Portland is also known to have a much higher percentage of bike riders.(and bike thefts) I would hate to see the statistics for large city #200.
There was no speed limit until the 1950s. Until then, cars generally didn’t go faster than 20 mph. In interviewing my mother, nearly 90, she told me that it was easy to walk and bike where she grew up near Chicago in the 30s because there were fewer cars and they didn’t drive very fast. We have inherited the danger with increasing the speeds.
Urban speed limits predate the motor car. New York City speed limits date to 1652, prohibiting horses and teams from traveling at a gallop in town.
Many cities adopted bicycle speed limits in the 1880s-1890s, driven by concern over “scorchers” who frightened horses and ran down pedestrians.
The first uniform, state-wide speed limit law was in Connecticut, in 1901, with limits of 12 mph in cities and 15 mph in rural areas. Private cars were still quite rare, but there were growing numbers of electric taxis and jitneys.
The first uniform, state-wide vehicle code came two years later, 1903, in New York.
The first mass-market private car, the Model T, didn’t launch until late 1908.
While speed limits and mixed traffic kept speeds low in cities before WW-II, the Model T was capable of 40-45 mph.
The horrific carnage of accidents at those speeds are what led to the imposition of driver licensing. Legislative and court records of the 1920s and 1930s recognize the exceptional new danger posed by cars. Court decisions noted that the Constitution would never allow such regulation of citizens going about their business on public streets by foot, on bicycles, or in carriages, but the motor made cars an entirely different category of public hazard.
Drawing a quantitative trendline (with an R^2!) when the x-axis is categorical, not continuous (or even quantitative!) doesn’t make much sense.
Thanks for posting this, Tom (I didn’t even see it until just now!)
I used my Gene Balk stealth filter. Somehow you have broken through. Hmm…
[…] The new safe bike lanes on 2nd Ave have tripled bike traffic already. It’s also one of the safest cities in the US for pedestrians and cyclists. The Seattle area has long been one of our top markets for […]
[…] by that measure, Seattle is among the best, especially for a big US city. In fact, a 2014 report ranks Seattle as the second-safest big city for people walking. The only city to rank higher was […]
[…] and Walking’s 2016 Benchmarking Report, which was released Wednesday (the report comes out every other year). It’s packed with data comparing major cities by a number of different measures. Seattle […]