As more people bike in a city, the total number of bicycle-involved collisions often remains flat. Sometimes it rises a little, and sometimes it falls. But the “safety in numbers” bike safety phenomenon is surprisingly consistent: The more people bike, the further the collision rate falls.
Seattle appeared to be the poster child for this. Between 2005 and 2012, problematic* (see below) Census surveys show that the total number of Seattle residents bike commuting increased 116 percent. During the same time period, the total number of bike collisions only increased 31 percent, meaning the bike collision rate per commuter was in free fall.
But collision data from 2013 and preliminary data from 2014 shows that this bike collision rate free fall has stalled. King 5 reported on the problem earlier this week. We obtained the same data set from SDOT, who stressed that the numbers won’t be finalized until this summer as more data comes in from the state.
2014 saw a fairly significant increase in the total number of collisions involving people on bikes, continuing an upward trend from 2013:
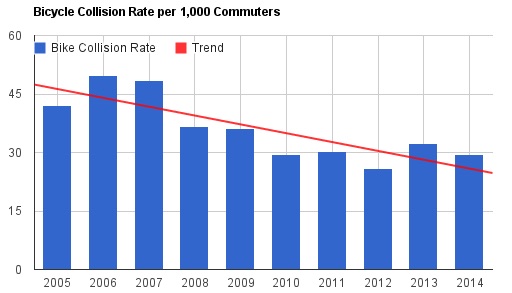
 However, the number of people bike commuting is increasing faster than the increase in collisions. This creates a fairly steep fall in the bike collision rate from 2005 through 2014 (bike commute data for 2014 is estimated, since the survey results are not yet out). But even this rate saw a bump up in 2013 and 2014:
 Now, it’s definitely possible that we’re just seeing statistical, random noise. In fact, 2012 may have been a particularly low outlier. And the collision rate in 2014 is still lower than any year before 2010.
But seeing the collision rate stall is not what anyone wants. It shows how vital it is to continue encouraging people to take up bicycling as a way to get around town. It also shows how important it is that the city builds out the Bicycle Master Plan and fixes known collision hot spots as quickly as possible.
The King 5 report tries to point the finger at the 2nd Ave protected bike lane, which is odd. That was not even installed until late 2014, and it’s only one street. Asking a single bike lane project to lower the entire city’s bike collision rate is not reasonable.
But people have continued to get struck and injured on 2nd Ave, which is historically among the most dangerous streets to bike. SDOT has planned a year-after review of the project to asses how it is doing.
The city also plans a protected bike lane on Roosevelt, another of the city’s bike collision hot spots. Another chronic problem area is the Pike/Pine corridor between downtown and Capitol Hill. Safety improvements there are listed in the Mayor’s Move Seattle Plan, as are the Ballard Bridge and the Burke-Gilman Trail Missing Link.
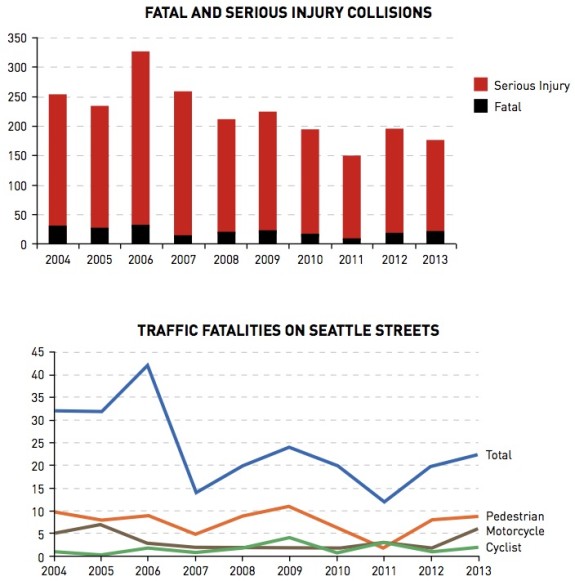
The good news is that total traffic injuries and deaths in Seattle are continuing to fall fast, as shown in these Vision Zero graphs:
 And the total number of people biking killed in traffic each year remains close to (but unfortunately not at) zero. Biking really is a safe way to get around town, but people biking, walking and using motorcycles bear an outsized number of traffic deaths. They are only involved in 5 percent of traffic collisions, but represent 50 percent of the deaths.
This is why Vision Zero places such a high priority on walking and biking safety. Collisions involving these more vulnerable road users are relatively rare, but the injury and death rate is high when collisions do happen.
Despite recent high profile examples of quality bike infrastructure in Seattle, there is a ton of work to do to actually create a complete, connected network of safe and comfortable bike routes. Today, there are big missing pieces in every part of the city. Sometimes these are stretches of outdated or sub-standard bike lanes, sometimes it is a busy street marked only with a sharrow, and often it is a bike lane that disappears exactly when you need it most: Major intersections.
The Bike Master Plan is supposed to take 20 years to complete, but that is too long to wait. If Seattle is going end traffic deaths and serious injuries by 2030, we’re gonna need to build the Bike Plan a lot faster.
* The US Census conducts the American Community Survey every year to track a lot of data, including how people commute to work. This is one of the most consistent sources of travel mode data we have, but it has some problems. For one, the sample sizes are small enough that the bike data varies significantly from year-to-year. So when you see Seattle bike collision rate plummet in 2012, then spike in 2013, that is very likely due in large part to statistical noise in the survey. But most importantly, the survey only counts work trips, making it a poor measure of total bike use. The Census estimates that only 20 percent of all trips are commute trips, so the vast majority of bike trips are left out. But the ACS commute data is a dependable annual survey for tracking changes and trends, which is why it is used so often.


Comments
3 responses to “Seattle’s plummeting bike collision rate may have stalled”
Are there metrics regarding the rider experience level pertaining to handling and speed, and the familiarity of the rider to the lanes-curio to dig deeper to root cause vs using protected bike lane vs no protected bike lane. Obeying speed and traffic rules, better education of riders new to city commuting and pathways and/or handling skills may be deeper issses if riders “feel” protected and make assumptions.
Not knowing how the numbers were put together, the first question is how precise they really are. What’s the precision of the cyclist population? It’s nowhere near as reliable as driving stats, but just how fuzzy is it?
How impartial are the bicycle collision stats? Do they reflect a real increase, or improved reporting as a result of political pressure and increased awareness?
Off hand, in a vague hand-waving sort of way, the change in slope looks to me like it would be lost in the shadows of uncertainty Around that prprecise – looking line.
[…] Stalling out: Seattle’s bike plummeting bike collision rate may be stalling out. […]