Editor’s Note: Every year, we write about newly-released Census data on commute modes in Seattle and communities across the country. In this guest post, Brock Howell dives even deeper, analyzing just Seattle’s new commutes. What he finds has lessons for what the city is doing right and what we need to change in order to meet our long-term and mid-term goals.
As the fastest growing major city in America, Seattle faces significant transportation and land use challenges and opportunities.
In the last five years, 70,000 new people moved to the region and the city is planning for another 120,000 to move here by 2035. Given this enormous surge of people, I wanted to see how our new residents are getting around and what that might portend for the future of walking, biking and transit.
Each year the U.S. Census Bureau publishes the results of its annual American Community Survey (ACS), which among other things shows the ways workers say they commute (SOV = Single Occupancy Vehicle).
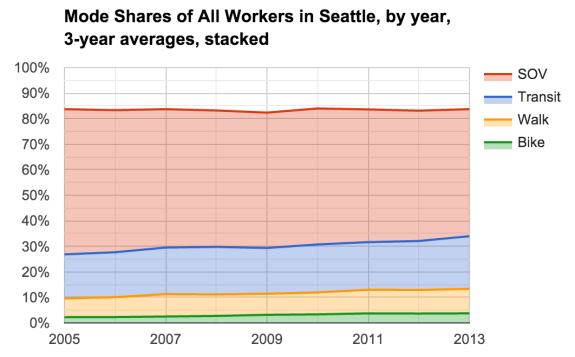
The total rates, however, do not tell the story of the new workers. In order to do this, I analyzed the ACS data by applying all annual changes to commute mode shares strictly to the annual changes of the employment levels. Below are my twelve takeaways.
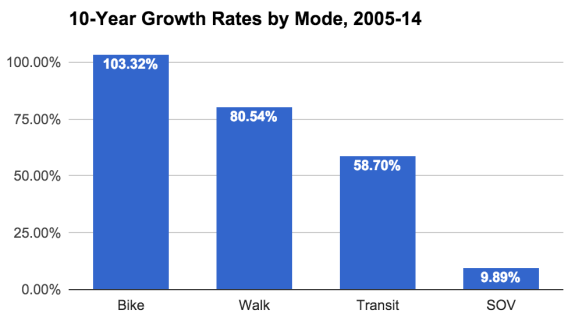
- The number of workers who bike to work doubled in the past decade.
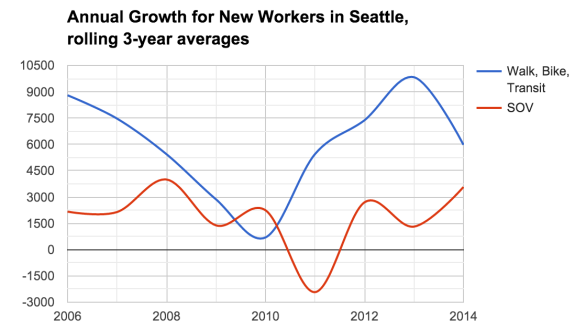
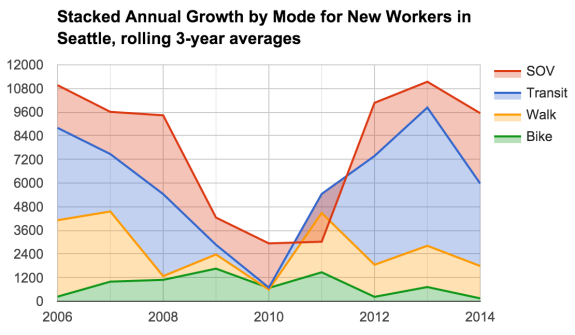
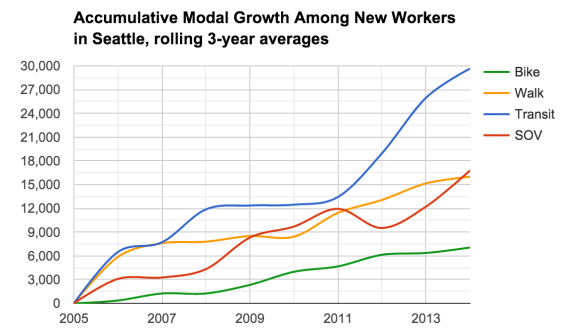
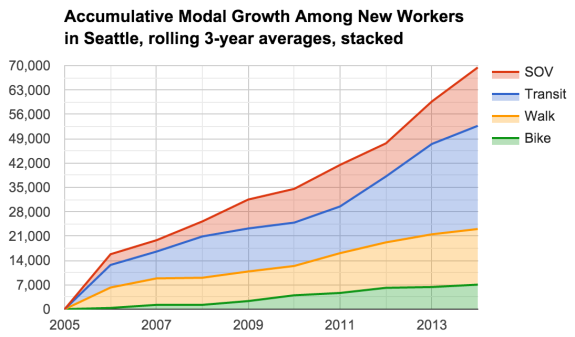
- In every year except 2011, more new workers chose to commute by walking, biking and transit than by driving a single-occupancy vehicle. From 2005 to 2014, 66 percent of new workers walked, biked, or rode transit to work, while only 21 percent drove SOVs. By comparison, the entire workforce has a 50 percent SOV commute mode share.
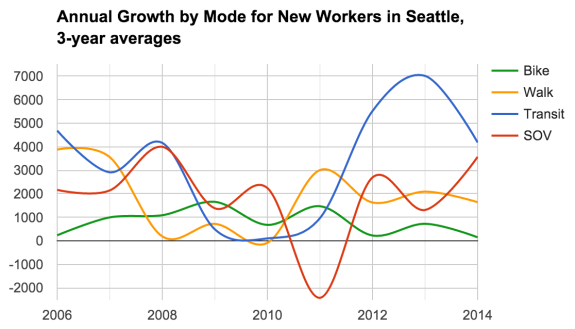
- Once the recession ended and employers started hiring, new workers took to transit at an unprecedented level. Central Link light rail opened in 2009, with its first year of full operation in 2010, the low-point of the recession. Once the recession ended, our investment in Sound Transit paid off. From 2012-14, 58 percent of new workers chose transit.
- New workers like to walk to work. With the exception of 2009 and 2012-13, new workers chose to walk about as much as to ride transit.
- Slow but steady: Bike ridership gained consistently. Unlike the volatility of the driving, transit and walking numbers, biking steadily gained new riders.
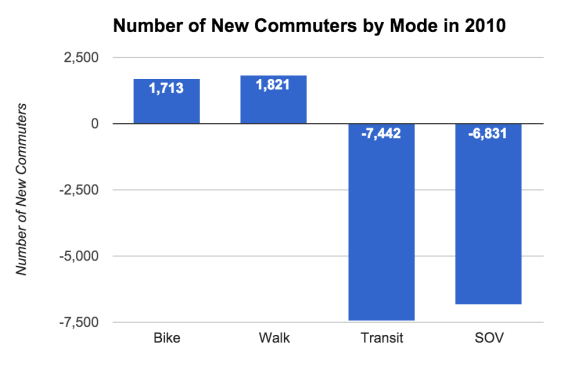
- The loss of jobs meant a lot less commuting. The lowest point of the recession was in 2010, when both transit and driving each lost more than 6,000 commuters.
- To stay employed during a recession, walk or bike to work. During the worst year of the recession — 2010 — both transit and driving lost more than 6,000 people each, but biking and walking actually saw increases.
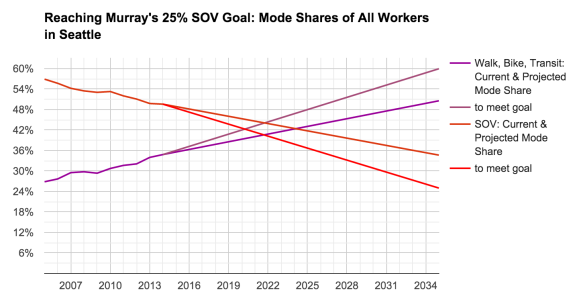
- If we maintain the growth rates of the last five years, walking, biking and transit will surpass driving single occupancy vehicles at the end of 2024.
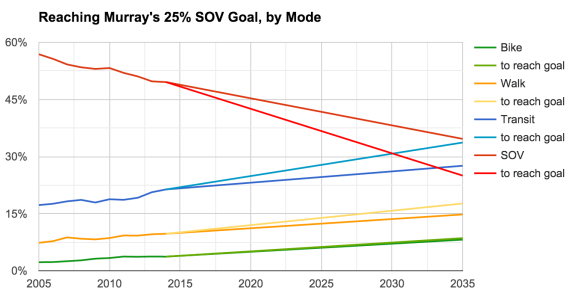
- To reach Mayor Murray’s 25 percent SOV goal, Seattle must accelerate the trends. Mayor Ed Murray set a goal of reducing the commute mode share of single-occupancy vehicle (SOV) driving to 25 percent by 2035. However, based on the current rates, Seattle will have a 35 percent SOV commute mode share in 2035. To reach the mayor’s goal, walking, biking and transit gains must accelerate, and surpass SOV driving in 2020.
- Seattle will achieve a 8.2 percent bike mode share in 2035, assuming current rate and that the ratio of biking, walking and transit will remain the same. By comparison, Portland had a 7.2 percent bike commute share in 2014. If Seattle’s meets Murray’s goal, bike commute mode share will reach 8.5 percent. Either way, based on the trends of the last five years, Seattle would fall short of its Bicycle Master Plan’s goal of quadrupling bike ridership by 2030.
- To see continued gains, we must continue to invest in infrastructure. From 2007-14, Seattle built more than 53 miles of bike lanes, rechannelized several streets for safety, opened new light rail and streetcar lines, and added tens of thousands of new apartment units in walkable neighborhoods. Without these public and private investments, we would not likely have seen the substantial gains in biking, walking and transit ridership.
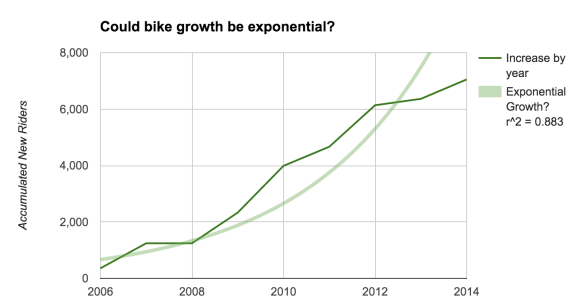
- With new infrastructure investments, transit, walking and biking could grow exponentially, outstripping last decade’s rates.
All my projections were made assuming linear growth. However, Seattle is making huge investments in our transportation system that will pay off. New light rail, new streetcar, more bus service hours, and new downtown protected bike lanes are all scheduled to happen this year. The Let’s Move Seattle levy will do more for walking, biking and transit in the next nine years than in the city’s history.
Based on the recent surge of transit ridership thanks to the Central Link light rail, we can bet our transportation investments will lead to unprecedented changes to workers’ commuting — for the better. If we can build out more than half the Seattle Bicycle Master Plan in the next ten years, we may yet still meet the BMP’s goal of quadrupling bike ridership.
Conclusion
Based on the ACS data, new workers are significantly less likely to drive a car to work than the general population of the workforce.
But we have much more to do. The Seattle Climate Action Plan calls for reducing vehicle miles traveled by 20 percent and the Bicycle Master Plan calls for quadrupling bike ridership by 2030.
If we’re to achieve either goal while maintaining adequate mobility for 120,000 new residents over the next 20 years, Seattle will have to significantly increase its pace of developing its transit, pedestrian and bicycle infrastructure. Luckily, the Let’s Move Seattle Levy and Sound Transit’s light rail expansion should help us make it happen.



Comments
34 responses to “Howell: As Seattle adds jobs, how are the new workers getting there?”
Honestly, I see that authors are trying hard, but it’s obvious that biking uptake is downhill.
More people prefer walking and well SOV is really gaining last few years…
I’m definitely interested in seeing the 2015 data. There’s an incredible amount of volatility year-to-year, which is why I used 3-year averages (using the before & after years). What is clear is that we’re adding new bike riders every year, although maybe not as quickly as we hope.
Do you have to just solely bike?
There’s no way that happens, with me.
Free bus ride, 10 mins faster, and blocks to my destination.
Or a 7 mile slog of up and down hills. Which then needs maintence.
So even a couple bus trips saves me money in the long term.
Brock, which ACS dataset are you using for this analysis?
The message is very different whether you look at raw numbers (which Brock largely did) or whether you look at percentages.
Because bike use started at a very low level, comparing raw numbers next to much larger ones can look visually dispiriting. I’m betting if he graphed the percentage change, it would be more hopeful.
That’s right. Because there was so much volatility year-to-year in data, graphing percent changes for each year didn’t work out well. So, instead I only graphed the percent change over the total decade. As you saw, biking and walking experienced the greatest percentage increases in numbers of people partaking (103.3% & 80.5%, respectively).
I think this has as much to do with where the new housing is than anything else. For all its faults, it just makes sense to take transit if you live in Ballard, Capitol Hill or Rainier Valley. If you live downtown (and their is a lot of housing growth downtown) then it makes sense to walk. In many cases it makes sense to walk from Capitol Hill or the Central Area as well (to First Hill, for example).
I see a lot of growth in areas that are really well served by bike paths coming in the next year or so. There are a bunch of new places going in close to the Burke Gilman in Wallingford and up the hill a bit in Fremont. When Link gets to the UW, it might also make sense to bike, then take the train into town. In that case, just like the census figures on race, you will need to add to add a “mixed” category for transportation mode to work.
It could also be rollover of residents. A 65 year old retires, sells Ballard home to a 35-year-old couple moving to the city. The younger newcomers are more likely to ride transit or bike than the outgoing older cohort.
An absurd number of people drive to work from my neighborhood in West Seattle to downtown, though the 57 gives a one-seat ride that’s usually faster in the mornings than driving due to bus lanes (driving is slightly faster in afternoon). So “it just makes sense” to use transit here too, but there’s certainly room for growth. I see a generational divide on my block: those in 20s and 30s mostly take the bus, those in 40s, 50s, 60s mostly drive.
I suspect a lot of the older folks do it out of habit — they drove downtown in 15 minutes for years while the buses took 30 minutes, so maybe they continue to assume the bus takes twice as long as their now-40-minute drive, when in fact its 30 minute ride now beats their drive.
And agreed that ULink is gonna revolutionize N-S travel via bike+train combo. 10s of thousands will be liberated from hellish drives or hellishly congested bus rides or hellishly scary Eastlake bike rides, once that tunnel is open connecting the two sides of the ship canal.
I have always wondered how split modes work for reporting this data. If I ride to the transit center, then take the bus, am I cycling to work, or taking the bus? Is it by miles or by time spent?
Good question! Depends a little on the respondant’s interpretation & answer to the survey, but the respondant is supposed to say the mode which is the longest distance. So, if you live on Bainbridge, bike 2 miles to the ferry, take the ferry across Elliott Bay, and then walk a half mile to work, then your listed commute mode would be the ferry trip (transit).
We could meet the 8% 2035 bike mode projection tomorrow if there was a way to safely bike across the ballard bridge and easily connect to the Elliott Bay trail.
Personally, I think there are five transformative projects that need to be built to achieve a bike mode share passed 8%: (1) network of downtown protected bike lanes, (2) protected bike lanes on Rainier Avenue from Rainier Beach to downtown, (3) protected bike lanes on Eastlake Avenue from the U District to South Lake Union, (4) Ballard Bridge, and (5) Missing Link.
Also, don’t let the Fremont Bridge counter fool you. The counter counts 1,800 to 4,000 bikes a day, which is 900 to 2,000 people — not all of whom are commuting (and therefore would be counted by the census). We have to do more than simply double the number of people biking across the bridge.
Agree with Matt, when you add in the Westlake Cycle Track and the what, 3000 Expedia workers who will be relocating their work to Interbay?- I assume this contributes mightily to the price pressures on SF in Ballard and the drive to build more housing in Ballard, period.
Well, I’m going to disagree with you and Matt, 8% of 3000 barely even matches a rainy Sunday for the Fremont bridge counter, well, ok, if they make a round trip it would be more, but still a fraction of a Fremont weekday. Even that assumes that those 3000 Expedia employees live in Ballard.
Beyond the Expedia people, to get to 8% for the city, the number of riders would have to at least double, do half the potential bike riders in Seattle really live in the west side of Ballard? And even if they do, first someone should have told Pronto, but are they all really going to the west side of downtown? note that there is a fair elevation gain to get from the Elliot bay trail to much of downtown, plus it is a 6+ mile ride from Ballard.
The Westlake cycle track virtually connects to the Fremont bridge, since there are trails on both sides of the canal why would anyone using the WCT cross the Ballard bridge? That is not even considering that the WCT is not designed for commuters.
As far as light rail goes, just how many bikes can fit on a train? sounds like a job for bike share, except, how many people fit on a train compared to how many bikes are at a share station, and how many station are near where people want to go after they get off the train?
If they spent the 50+ million the gold plated Ballard bridge retrofit would cost, on bike share, Seattle could have a world class bike share system, but they won’t, and even if they did, since that that $50M wasn’t spent on bike infrastructure the usage would probably still be somewhat mediocre (and don’t forget the elephants). And of course, if $50M was spend on bike infrastructure, the number of people riding their own bikes (who vastly outnumber Pronto riders) would increase.
Bikes on trains just isn’t practical. It doesn’t scale. It might work in the middle of the day, but even then it is likely that the train system you built isn’t working very well (if it was, there wouldn’t be much room for bikes). So yes, bike share could work out really well. But bike lockers can also play a very big part. I think the Husky Stadium station should have a huge bike locker. For many, that’s a very fast, safe, easy way to get downtown. Ride the Burke, park your bike, take the train downtown. Getting to Capitol Hill or First Hill this way is even better.
Oops, ST forgot to put in a First Hill station. This makes things a bit trickier, and argues for good bike share in the area. So now you ride your bike, take the train, then ride Pronto a half mile or so to your job. Taking a bus on the other end might work as well, but it might be a challenge (the one station they put in there is challenging from a bus to rail standpoint). Madison BRT will help in general, but it won’t intersect the light rail.
It does appear that bikes on the Link rail would not scale. Can bike lockers scale? How much space do they take and what is the cost?
I am a huge fan of bike lockers and actually rent two myself. I have one at the light rail station closest to my house – it is so nice and convenient to roll up, unlock, roll the bike in, drop the helmet and extra layers in, close and walk away. No fuddling with accessories that will get stolen, less stressing about my bike still being there when I get back, and less dings from other’s locking up next to me. I also rent another in my office building downtown.
Bike lockers can scale pretty well, certainly compared to parking stalls. There are a number of different designs available. The one I use at the light rail is pie-shaped and you roll the bike in. It takes up more square footage but is more convenient to use and you can squeeze two bikes in without much trouble (particularly nice if heading downtown for dinner or a concert with a partner.) They also have a few banks of the rectangular-shaped lockers. You can see both designs in this picture: http://r1.masstransitmag.com/files/base/image/MASS/2012/03/16×9/640×360/soundsustainability2_10684007.jpg
The locker I rent at work takes up less floor space. It is also pie-shaped but the bike is stored vertically, resting on the back wheel. The floor of the locker has a ‘wave’ and the tire rests in it’s trough. I had to make a few modifications (some wood blocks on the floor and cloth taped to the walls) to make it work for one of my bikes as my brake levers hit the walls before the front tire hits the back of the locker. Looks similar to this: http://ameribike.com/wp-content/uploads/2013/05/american-bicycle-security-products-bike-lockers-300-series-4.jpg
The nice thing about them is you can take advantage of corners and other pockets of under-utilized space.
I’m going to gently hijack this post to spread a new idea. It’s relevant to people who might bike & use light rail.
First, Hi Brock, it’s fantastic to see you supporting Tom & Seattle Bike Blog.
The ST3 is in design and a vote will be coming, asking for funding. Part of the proposal will be to connect Ballard and downtown. What’s sorely missing, though, is an east-west connection. If you want to go by light rail from Ballard to the U district, you’ll have to go downtown first. Not a desirable option. A lot of people who live west also commute to the east side. But it’s really hard to get from Magnolia or Interbay to 520 by bus.
So, cut to the chase. A relatively short, thus less costly, tunnel link could be built between the Ballard line and the about-to-open UW line. Depending on the Ballard line alignment, it could connect in Uptown, stop in South Lake Union, and then at the Broadway station. Also consider the fact that the Mercer Street corridor is saturated and can’t handle any more traffic, doesn’t connect to Capitol Hill very well, and has no transit lanes, nor bike lanes.
With a bike on board, people all over Magnolia, Interbay, Ballard, Queen Anne, could then get to destinations on Capitol hill, the U District, and connect with buses to the east side. People on the east side could get to work at the upcoming Expedia site.
Perhaps this idea has been brought up, and I simply didn’t hear about it. Regardless, I’d like to spread and “incubate” the idea.
A lot of those ideas have been discussed, so you are right in thinking they make sense. A lot of people who know quite a bit about transit think that the best subway line we could build (now) would be from Ballard to the UW. Not only would this be cheaper than Ballard to downtown, but it would serve both routes. Going from Ballard to downtown via the UW is no big deal — it would only take an extra two minutes.* But going from Ballard to the UW via downtown would take about 20 minutes longer — you might as well just take the bus.
At the same time, there has been a lot of discussion about a couple other plans. First another tunnel, but for buses. This would be cheaper and serve a more disperse area. The combination of that, plus West Seattle improvements and a Ballard to UW light rail line is what several people (including myself) think we should build for ST3**.
There has also been a growing consensus amongst transit wonks that another light rail line, similar to what you propose, would make a lot of sense. This has been called a “Metro 8” subway, because it would follow the general route of the Metro 8. There are a bunch of options, none of them have been presented, in part (I think) because the choices between them are not obvious. But the general route would include stops in Uptown, South Lake Union, the Capitol Hill Station, somewhere on Madison, somewhere on 23rd, the Judkins Park station, and the Mount Baker station. Another variation would be to skip Uptown, but curve around to serve Belltown, then continue the curve and connect to the other transit line.
In any event, while these projects have been discussed, there has been very little discussion about how bike travel would integrate with it. It is an important topic. But I would say that for the most part, taking bikes on trains doesn’t work very well. It is done, but it doesn’t scale very well. It only makes sense if the trains are fairly empty (and if they are fairly empty, then we just spent a huge amount of money for very little). But bike share and bike lockers make a lot of sense. I haven’t thought too much about how these projects would interact with bike service. I know they would connect really well with crossing bus service, but I’m not sure about bike travel.
Off the top of my head, I think it would work out fairly well. The UW to Ballard plan would have the advantage of serving both the bottom and top of the hill. Those in Ballard would easily ride to the station in 15th. On Phinney ridge, you would connect to that station — likewise for upper Wallingford. The only real controversy over a Ballard to UW line is whether to put the station in upper or lower Fremont. If you put it in upper Fremont, then it connects well with buses serving Phinney Ridge (and Greenwood). Likewise with bike travel (it is a nice fairly flat plateau up there). If you did that, then folks in Fremont could take a bus up the hill, or ride their bike on the Burke and then up 8th.
The Metro 8 subway would be similar. Destinations in South Lake Union spread out quite a ways, making them a good choice for bike travel. Likewise the entire First Hill/C. D./Capitol Hill plateau is a big, broad area that can’t be completely served by light rail — so bikes (along with bus service) can help fill in the gap.
I would say that bike share and good public transit go together. They definitely help solve the “last mile” problem. This isn’t the biggest use for bike shares (or biking in general) but it is significant***.
* http://seattletransitblog.com/2015/08/14/fast-train-to-ballard/
** http://seattletransitblog.com/2015/11/30/an-alternative-for-st3-with-something-for-everyone/
*** http://www.treehugger.com/bikes/why-do-some-bike-share-systems-succeed-and-others-fail-bike-sharing-planning-guide-explains.html
Thank you. Great info.
Speaking of secure bike parking and rail, how on Earth did Judkins Park station get approved with a parking capacity of 30 bikes?
It’s going to be right on the I-90 Trail, it’s going to be right on the new Neighborhood Greenways network, it’s within a five-minute bike ride of tens of thousands of residents, and it’s going to have 20 minute service to UW and Bellevue.
Only 30 people are going to be smart enough to put the pieces together and bike to the station?
Or all the rest will take their bikes on the train?
Although your graphs look great, I would like to point out that most of them have only 9 data points. Nine data points over as many years is about as far from continuous data as you can get. Connecting the points with straight lines or splines is misleading either way. I understand discrete plots don’t get the point across as well, but you should at least show the data points you are arbitrarily connecting together.
Also why does the slope of your exponential growth line start with zero slope in 2006? Was that year special in some way as the catalyst of bicycling in Seattle? No, you could fit 9 janky points to any curve you wanted. You might start by trying a straight line since it looks like you would get an even better regression value from that.
As you say, you don’t really have enough data to even analyze. I take issue with your data visualization. Thank you.
Yeah, nine or ten data points isn’t much. It is on a timescale, so I’m comfortable with a line graph that helps the reader see when the ridership is going up or down.
Also, I totally agree with the problems with the exponential curve of the last graph (and the one featured in Facebook posts). I wish it wasn’t the featured image. The exponential curve isn’t meant to be some rigorous mathematical exercise, but merely to illustrate the #12 narrative about how a number of factors may result in bike ridership increasing faster than on the linear projects to 8.3% in 2035.
Have to agree with the last comment, especially about the last graph. The increase in biking looks more linear than exponential. That last graph was the leader on your fb post, including the tag “Could bike growth be exponential?” Kind of misleading.
Yep, see my reply comment above.
The auto-posting machine picks the Facebook photo, and I can’t change it without deleting the fb post and reposting (it’s 2016! This should be easier to fix by now). But that would delete the conversations and likes, etc. It’s not the lead photo I would have picked, and I should have double checked when I posted to make sure it had a good photo (usually it picks the first image, which would have been better)
[…] commuters: New Census data reveals some interesting data on how newer Seattleites are choosing to get around the […]
Excellent analysis, Brock.
Does the census release tract-by-tract data on mode of transport? It would be interesting to see comparison by Seattle neighborhood or district.
Very interesting analysis. I am wondering if you could also look at the data by age group. It’s my guess that the new employees are heavily weighted towards younger people. These people are more likely to be fit, have more money so they can live next to their worksite so that they can walk and bike more easily than the average population. If it’s not possible to look at their commuting patterns alone then a comparison of age breakdown of the new 70,000 people with the total population would be very instructive.
[…] another planners project another 120,000 new people by 2035. Last week on the Seattle Bike Blog, I published my findings from the last decades-worth of data from the American Communities Survey on …. From 2010 to 2014, just 18.9 percent of new workers drove to work while 8.3 percent biked and 45.4 […]
These changes will boost your overall health along with the health of your hair.
Weight loss programs should not result in hair loss;
instead, select a healthier, nutritionally-sound
approach. Where to buy biotin for hair growth When used as outlined by standard
dosage levels, vitamin supplements are a safe and okay means of maintaining the mandatory daily biotin levels.
Biotin is indeed important that a good mild deficiency can in fact cause dermatitis,
a skin condition seen as a itchy, scaly skin. Even should you
sit back at home, nice hair develops dead scalp, thus to take
out those dead scalp, washing hair with a regular interval
is vital.
Established by Frederick August Otto Schwarz with his fantastic
three brothers; this store is regarded as the famous toy store in New
York. The rental for a rubber toy is kept reasonable so that people can hire over one party
toy for their little guests. List of every nerf gun ever made Andy donated his toys to someone else so they
could provide her with the time saving benefits they once had given him.
This is the place toys created from India and China have tested and verified for
high lead content. There are toy parts that are available to get bought,
and most of all an available RC toy available.
[…] transportation systems and housing. Fortunately, many of the newly employed within the region are choosing active transportation and transit over driving, alleviating some congestion that might otherwise […]