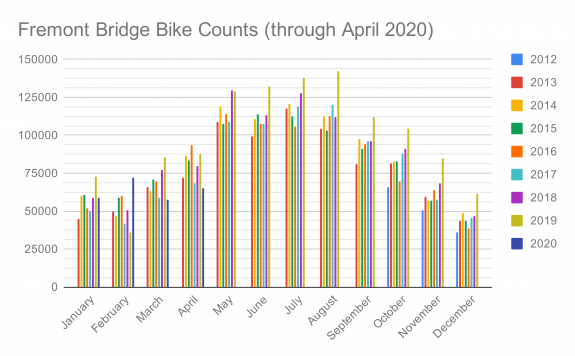
 The number of bike trips across the Fremont Bridge in February was 47% higher than the February average from 2013-19, continuing a trend of strong year-over-year bike trip growth in recent years.
But then March happened, and employers shut down offices and fired workers. Unemployment skyrocketed along with working at home as our city attempted to slow the spread of the coronavirus that causes covid-19. And you can easily see this all play out in different ways through the data collected by the city’s 24/7 bike counters. I taught myself some new spreadsheet tricks and reorganized my bike counter data system, so I have a bit of new data to share.
Let’s start with the Fremont Bridge, typically the busiest single crossing point for people biking because so many different local and regional bike routes funnel to this single crossing of the Ship Canal. As we reported earlier this year, the bike counts across the Fremont Bridge completely shattered all previous records in 2019. It wasn’t even close. 2019 counts passed the all-time record for bike trips in a single year just a week or so after Halloween, and the counts did not slow down after that.
The new year didn’t stop the momentum. Even with January’s snow, 2020’s count was a few percent higher than the average January, most of which had no snow at all. And February, wow. February was a stunning 47% higher than the average of all previous February counts.
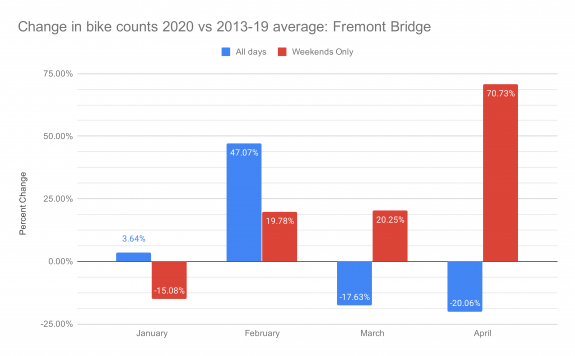
Then people started dying of covid-19, and we realized the virus was already here. As society completely reorganized itself, the way we typically gauge bike use became obsolete over night. The Fremont Bridge bike counts plummeted because commute trips, especially trips headed downtown, plummeted. The fall was not as precipitous as the fall in car trips, which were down more than 50% in Seattle, but the shift from a 47% increase in February to an 18% decrease in March is symbolic of how quick and difficult the shift to life under lockdown was.
To top it off, the Fremont Bridge is almost exactly the kind of bike route you want to avoid right now if you can. Its very skinny sidewalks make it impossible to maintain at least six feet of separation from others. So unless you need to cross the bridge, you probably shouldn’t (or you should at least be patient and wait for the path to clear out before crossing).
But Fremont never told the whole story of biking, it was just our busiest counter. And looking at other counters or focusing on weekend trips vs weekday trips, and you start to see a very different story about the role bikes are playing during the outbreak. For example, the reduction in commute trips brought the Fremont Bridge bike count down 18-20% compared to the average, but weekend trips were up an astounding 71% in April. Though it’s far from exact, weekday counts tend to be more commute-dependent and weekend counts tend to be more recreation-dependent. So clearly, there has been an enormous boom in the number of people using bikes to get out of the house, have some fun and get some much-needed exercise.
 Seattle was already experiencing a historic biking revolution before covid-19 came to town, but bike sales have gone through the roof nationwide since the lockdown hit. People are looking for healthy and responsible ways to get outside, get around and get some exercise. And many people are trying to avoid taking transit, but can’t or don’t want to spend their tight budgets on the many costs of car ownership. So bikes are filling many different places in people’s lives, whether they are essential workers trying to get to work or people getting cabin fever at home.
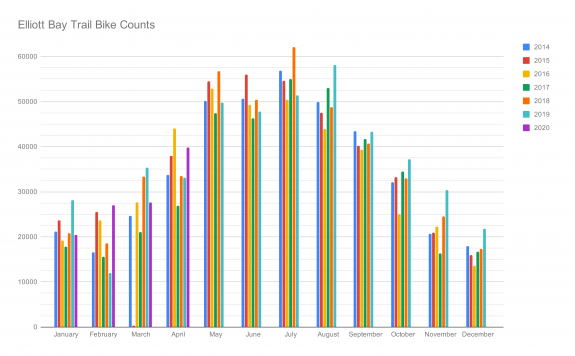
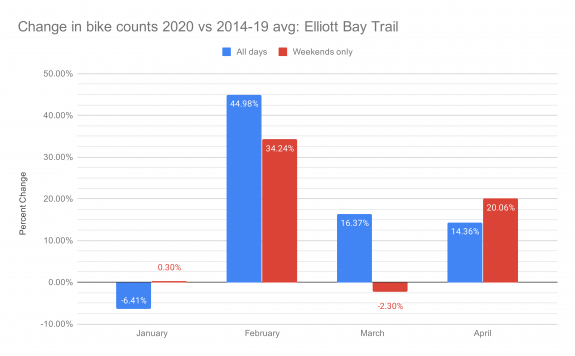
Let’s look at the Elliott Bay Trail in Myrtle Edwards Park. This trail does carry commute trips to downtown, but it also serves as a major recreation route for people looking for a lovely bayside bike ride. Bike trips were also way up before the outbreak, clocking in at 45% above average in February. But even when workplaces shut down, bike trips have remained well above average. Oddly, weekend counts dipped in March before rebounding in April.
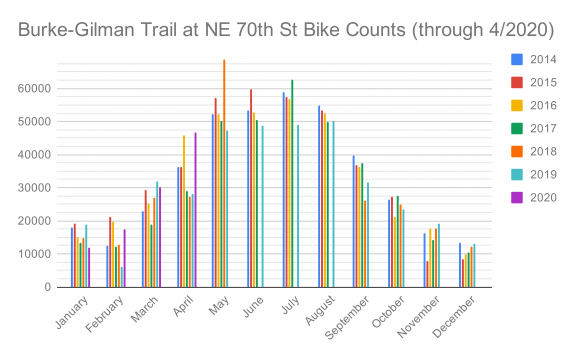
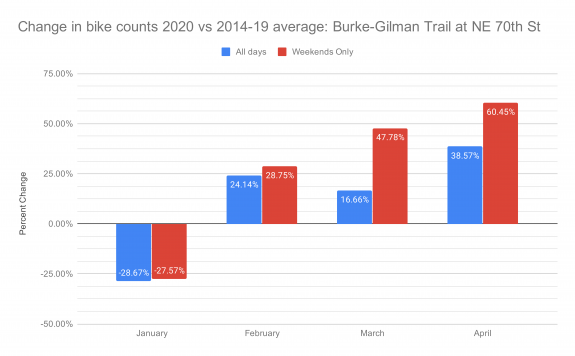
 Similarly, the Burke-Gilman Trail at NE 70th Street, beyond the primary Magnuson Park entrance, also shows continued growth in ridership even after the outbreak hit. In fact, biking counts were growing faster in April than they were in February. Because the counter is located north of most of the trail’s major destinations within Seattle, this counter likely captures a more recreational pattern than if the counter were located on busier sections like UW campus or Wallingford.
 When you consider the massive drop in car trips during this time, the results of these counters are remarkable. But it isn’t a huge surprise if you’ve been following bike industry news. Sales of bikes are through the ceiling all over the world, and Seattle is no different.
“The demand we’re seeing now and the increase in business is unlike anything we have seen in our history of the company. I mean, April and May have been busier than any month than we’ve had in our ten years we’ve been a bike shop,” Bill Brown, Ride Bicycles Sales Manager said to KIRO 7 News.
In fact, stores and distributors are running out of bikes to sell, a problem that is likely to persist through the summer. We are going to need to get creative about how to help our community members get bicycles, especially because they are running out of the lower-cost options first.
As with all our posts about the city’s bike counter data, there is a big blind spot in south Seattle. There is no bike counter providing a quality snapshot of biking trends from Rainier Valley or South King County. That needs to change.
My new system for tracking bike counter data will also be much easier to update as monthly data drops come in (basically, I learned how “SUMIFS” formulas work and, yeah, they are real time-savers). You can view or download the spreadsheets yourself if you’re into that kind of thing. I’m also open to feedback on how to organize them better. Email [email protected].
The Spokane Street Bridge bike counter also has some interesting data since the West Seattle Bridge closed. Stay tuned for a separate post about that.



Comments
6 responses to “Bike counters show weekend and trail rides are up as much as 70% since the outbreak began”
The west Seattle data is about to get really interesting. With bridge repair/replacement and light rail a really, really long way off bikes just became a critical part of the transportation plan for west Seattle regardless of whether the city decides to acknowledge it or not.
Every cloud has a silver lining I guess. I think covid 19 is going to permanantly alter the way people think about streets, cars, bikes, and air quality. I’m also thinking the covid triggered the most effective response to global warming we have seen to date.
I have avoided the bike trails after some early, crowded experiences. It didn’t seem quite possible to maintain social distance with all the walkers and bikers, especially on the Burke-Gilman and especially on weekends. The streets, however, have far fewer cars than before and have made for some nice bike riding. The greenways were perhaps best of all–some of them were closed to all but local and delivery traffic. I have even started liking the 39th Ave NE greenway.
Interesting analysis. Like Chris Burke, I avoided the Burke-Gilman, especially after the King County Parks technically closed the trail outside of Seattle, and I thought the intent was to leave it for commuters in the city. (I’m riding recreationally.) So it’s especially dramatic, given that some number of riders–probably small–was riding more than usual and not being counted on these trails. Now that the King County Parks trails are re-opened, I am not avoiding the Burke-Gilman any more than I did before the pandemic. I wonder about what the 520 trail counter would show, which I don’t see among your spreadsheets. The 520 trail wasn’t closed, since it’s not part of the King County Park system.
The 520 trail counter has been broken for weeks or at least the display is not showing that the number of users is increasing. Every time I have ridden across on the weekend it has been very busy with riders and runners and also busy on the weekday evenings. I have no doubt that the results from the 520 trail match what is being seen for the other recreational bicycle routes.
Spokane Street Bridge days-of-the-week curve has flipped 180, to high counts on weekends and low during the week. Weekends have typically been very low counts, with far more weekday crossings, due to this bridge’s primary use as a work commute route to Sodo, Pioneer Square, Downtown and First Hill. But now, those bike commuters are at home, and starved for outdoor recreation, or nostalgic for working downtown, they and others are getting out for weekend rides.
“As with all our posts about the city’s bike counter data, there is a big blind spot in south Seattle. There is no bike counter providing a quality snapshot of biking trends from Rainier Valley or South King County. That needs to change.”
That’s a consequence of little real bicycle infrastructure down here in SE Seattle. It’s hard to count bicyclists that are forced to share a lane with cars. There are thousands of people riding on Seward Park Ave S. and Lake Washington Blvd S. on sunny weekends, but no bike lanes exist on these streets, not even paint.
One possible location for a counter would be on the southbound side of Rainier Ave S around 57th Ave S. Despite the lack of a bike lane, there’s a newer RRFB crosswalk at Seward Park Ave S. & S. Kenyon St that could possibly incorporate a northbound counter with a minor redesign to channel bike riders through. The new lanes on Columbian Way S. / S. Alaska St, west of MLK Way S, and Othello / Myrtle Swift, again, west of MLK, seem like obvious choices though likely with terribly depressing numbers due to steep hill climbs and lack of easy to reach connections.
The pedestrian and bike infrastructure that has opened in SE Seattle in recent years isn’t heavily utilized by bicyclists because it mostly doesn’t actually connect to anything else. It’s a bit like building a spiffy new, freshly paved 4 lane highway in the middle of a farmer’s field in Carnation that you’d need a tractor or 4×4 to reach, and wonder why it’s empty at rush hour. “If you build it, they will come”, but they have to actually be able to GET THERE without risking life and limb.
I’m thrilled that bike lanes are being created, FINALLY, in SE Seattle, but am anxiously awaiting some sign, any sign, that the city plans to link these into a cohesive network that allows riders to get from home to where they need to go, safely. Until then, they’re essentially Potemkin villages, nice marketing but little else, and the vast majority of bicyclists will continue to be 20-60 year old, fit male recreational riders on expensive road bikes, zipping around the Lake Washington Loop. Few women, kids, grandparents, new riders.