State law in Washington that dates from the 1990s requires that the Washington Department of Transportation complete a “bicycle transportation and pedestrian walkways plan”. The last version of the plan was created in 2008, and is getting a brand new update. A draft of part one of the plan is available to read and comment on at this online open house until February 15 of 2021.
Part one of the plan is in large part devoted to high level concepts around walking, biking, and rolling facilities, overall purpose and need, the current state of Washington’s active transportation infrastructure, and what WSDOT has heard from community member while conducting public outreach for the plan. Part two, which will come out next year, will cover specific policy topics around project implementation, performance measures, and next steps for developing an actual implementation plan- in other words, even deeper into the weeds.
The entire plan is worth your time, but at 184 pages the draft is a bit hard to get through. I want to highlight a particularly rich area of the report, in case you don’t have time to read it. Chapter 4 looks at cost estimates for statewide needs and opportunities. Early in the report, dropped in a section about benefits of active transportation is the fact that “for the approximate cost of one Seattle-area freeway interchange, approximately 300 miles of trail could be constructed”. These numbers come from WSDOT’s own planning level cost estimates, and it’s facts like these that are the best part of the report.
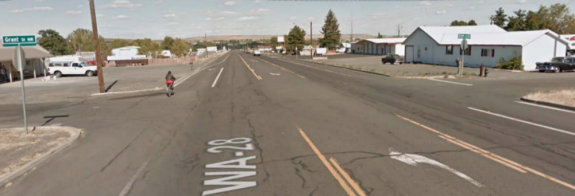
The report looked at the 6,977 miles of state highway and noted that 1,685 of them went through a city, town, or census-designated place. The plan looked at costs to improve state routes in those population centers in part because that is where a large majority of the bicyclist and pedestrian injuries and fatalities occur, 83% between 2010 and 2020.

86% of pedestrian and bicyclist fatalities in Washington occurred on roads with posted speeds of 30 mph or higher during the same timeframe. The active transportation plan looks at the mileage of state highways with posted speeds over 30 mph, 849 miles, and calculates a one-time statewide need to implement changes bring vehicle speeds below 30 mph at $283 million.
Also estimated is the amount of money to improve the 542 miles of state highways that do not have adequate pedestrian facilities and 1,142 miles where there are not separated bike facilities (on highways where people walking and biking are not prohibited) at $1.8 billion. Add to that $1.6 billion to improve crossing treatments at 7,564 locations on the state system, and 1.98 billion to improve 680 bridges on state routes where pedestrian & bike facilities are nonexistent or substandard.

Added together, the total for those improvements for safety and access to the entire statewide highway system totals $5.7 billion. These aren’t upgrades, they are basic elements that a statewide transportation system should have, before the state spends money expanding it.

Governor Inslee’s proposed transportation budget for the next two years totals $6.2 billion in spending, $3.7 billion of that for the Highway Improvements program, which mainly goes to expanding highway capacity, while a tiny portion of the biennial budget goes toward these basic safety improvements. Washington State has had a Target Zero goal for twenty years now, and the state’s transportation agency knows what it will take to make the changes needed to get us there.

We’ll be closely watching for part 2 of the Active Transportation plan to see how we can get there. In the meantime, read part 1 and submit your comments.


