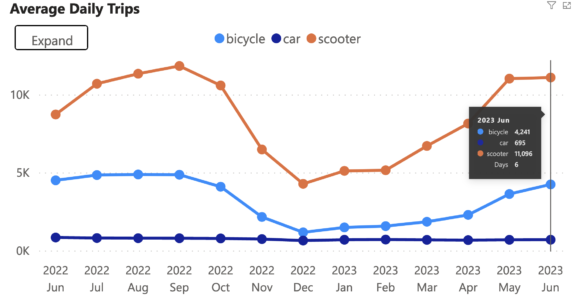
People in Seattle took 3.7 million trips on shared bikes and scooters in the past year, a massive rebound from the 1.4 million trips per year when pandemic restrictions and many business closures were in place. During the busiest summer months, the daily rides averaged over 15,000 trips per day.
Six years into the city’s sometimes turbulent experiment with free-floating shared bikes (and eventually scooters), the devices continue to move a remarkable number of people despite significant price increases. And while scooter trips still outpace bike trips, the rides per device are now similar, according to SDOT data.
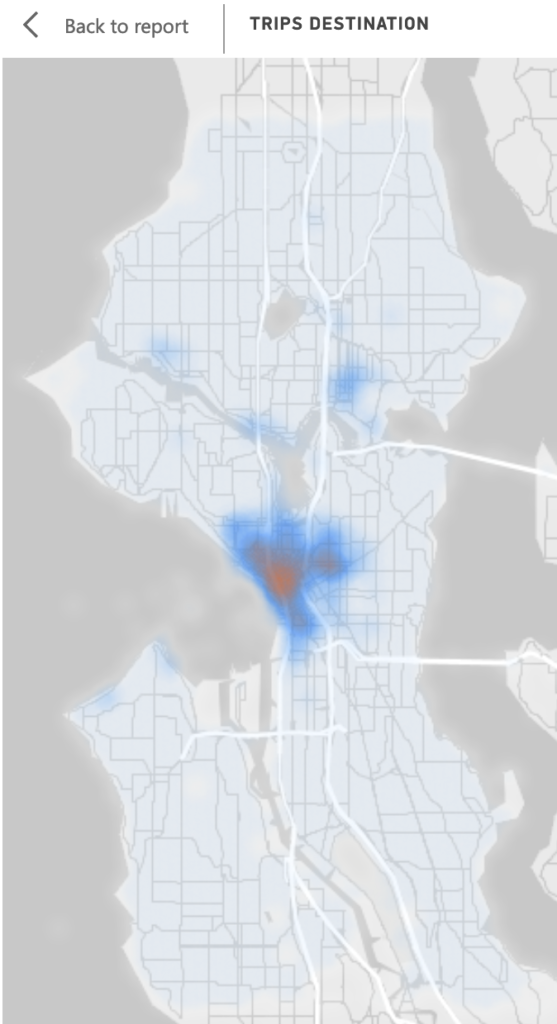
Most trips are destined for downtown and in nearby neighborhoods like Capitol Hill, First Hill, South Lake Union, Uptown/Lower Queen Anne and the International District. There are also significant hot spots in the U District, Ballard and Fremont—neighborhoods connected by the Burke-Gilman Trail—as well as popular spots along the Alki Trail.

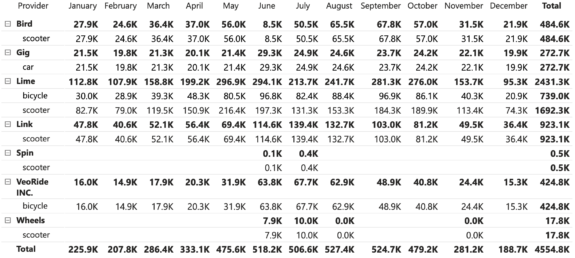
The industry has fallen back to earth after a few years of wild and fast expansion and competition thanks for venture capital funding and speculation. Bird is still operating, but its stock is down 99% since launching in November 2021 and is on the verge of being delisted. Lime has been able to maintain its spot as the top company in town while also being the only company to offer both scooters and bikes.

But perhaps the most interesting data point in all of this, other than the ride totals, is that rides per unit per day are more similar between bikes and scooters than they used to be. Bikes got about 1.1 rides per day per bike while scooters got 1.8 rides per day per scooter. Not so long ago, this number was skewed much further in favor of scooters. In September 2021, for example, scooters got 2 trips per scooter per day while the bikes got closer to 0.6.
I suspect that companies were a bit fooled by the popularity of scooters back when they were novel, which is why so many of them pivoted away from bikes. There was a scooter fad bubble that was not meant to last. Now we are seeing more realistic usage numbers that are likely more sustainable, and they show scooters getting only a little more use than bikes. As someone who has always preferred the bikes (I bike every day already, so I personally feel more comfortable and confident on a bike), seeing the two vehicles move closer together makes me hopeful that scooter companies may revive or start bike fleets. I also gotta give Lime credit for never giving up on bikes even though the industry was moving hard in that direction for a few years.
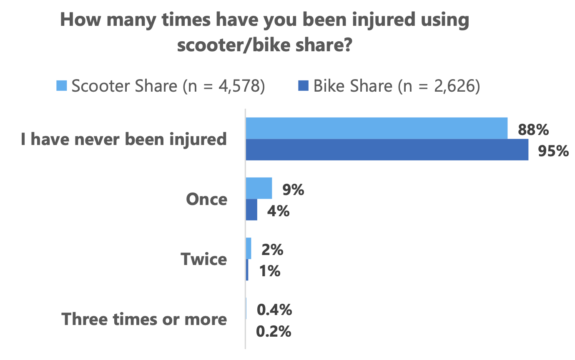
Lurking behind all these use numbers is the issue of safety, both real and perceived. Allison Williams recently penned an interesting piece for Seattle Met about being a scooter user, writing, “In a city that struggles with providing sufficient bike infrastructure, the even flimsier scooter feels like a downright death wish next to a 4,300-pound Chevy Silverado.” Of the 5,000 scooter share users who responded to a 2021 survey, 11% reported an injury and 22% of those injured said they needed medical attention. That’s not great. Perhaps there’s some self-selection bias going on with that survey, but that’s a lot of people no matter how you look at it. Police data showed 5 serious injuries and one death involving a scooter rider in the first year of scooter operations.
Bike share, on the other hand, has historically been shown to be as safe if not safer to use than even riding a personal bike. In the same survey, bike share users reported injuries at a much lower rate than scooter riders. And of those injured, bike share users were less likely to require medical attention. But as with traffic injuries in general, the number is still too high.

The top safety concern cited by both scooter and bike users was car traffic, and they both cited a lack of bike lanes as a problem, though scooter users were much more likely to cite concerns about bumps and potholes.
Meanwhile, pricing for Lime bike rides has risen to $1 to unlock plus 46¢ per minute (45¢ per minute for scooters), and most other services end up on par with this price though they all have their own schemes. Veo undercuts Lime by 7¢ per minute while Superpedestrian’s LINK undercuts Lime by 2¢ per minute. Bird has the most needlessly confusing pricing, charging the most expensive rate of all at $3.50 for the first five minutes but then lowering to 39¢ per minute after that. Most companies also offer membership plans of some kind that can reduce costs for heavy users. But no matter how you do the math, these trips have gotten a whole lot more expensive than than the $1 for 30 minutes they once were back when non-electric bike share launched in 2017. I’m actually a bit surprised to see ridership numbers staying as high as they are even with the increased prices. I know I have dramatically reduced my use of them due to the prices, but I am probably not the target user as a person who owns their own bikes and often travels with a child.
By the way, did you know each company is required by city rules to offer a low-income plan? If you are in just about any government-run low-income service including the ORCA Lift discounted transit card, you can get a steep discount on bike and scooter rides. You can qualify for ORCA Lift if your pre-tax household income is 200% of the Federal poverty level or lower. That’s $2,430 per month for a single person or $5,000 for a family of four, for example. See the full chart and get more info on the ORCA Lift website.
So while the failures and mergers are likely still not fully complete in this industry, could things finally be stabilizing? And if so, is this more stable position profitable enough to be sustainable without piles of new venture capital funding? As I always seem to say at the end of these bike share updates, I guess we’ll need to wait and see.


Comments
9 responses to “Seattle bike and scooter share users took 3.7 million trips last year”
Assuming an average speed of 10 mph, $1 + $0.45/minute equates to $1 + $2.70/mile + $0.45/minute stopped. For comparison purposes, the official taxi rates in Seattle are $2.60 + $2.70/mile + $0.50/minute stopped.
So, the cost to ride a shared bike or scooter is identical to riding in a taxi except that the meter drop is $1.70 less and there are no tips. And, of course, that’s for a single individual – a group of just two would actually *save* money by taking a taxi over bike/scooter share.
One other note about pricing – since the fares are per-minute, the cost per-mile actually goes down as the average speed goes up, so a two-mile trip down the Burke Gilman trail is actually quite a bit cheaper than a two-mile trip through the city center, where time stopped at red lights adds considerably to the fare total.
Me personally, besides being turned off by the high prices, I also can’t stand the price structure. I really don’t like seeing my bill go up every time I hit a red light or, worse, the Fremont bridge being up, nor do I like pricing systems that effectively reward users with a fare discount for dangerous behavior such as weaving through stopped traffic or running red lights. The $1 unlock fee also irks me because every time you discover a problem with a vehicle after unlocking it and have to switch to another one (hardly a rare occurrence), the company effectively gets rewarded for failure to properly maintain their vehicles with an additional unlock fee.
I personally think a much more transparent pricing model would be a straight-up per mile rate, with time-based fees only kicking in in half-hour increments over 30 minutes. But, of course, that would make it much more obvious just how expensive the service actually is, which is probably why Uber doesn’t do it. Psychologically, $0.46/minute doesn’t sound nearly as bad as the $2.70 mile figure people plastered all over the yellow taxis, even though the two are nearly equivalent.
Finally, I’d like to say that if a bike or scooter rental really needs to charge taxi-equivalent rates in order to turn a profit, there is something fundamentally fishy about the business model. A taxi has a paid driver accompanying the passenger for every trip. A rental scooter does not. A taxi ride consists of a full-sized car, which costs far more money to purchase, insure, and fuel, than an e-scooter does. The best theory I can come up with is that the lifespans of the bikes and scooters that sit on the street all day are very short, to the point where a vehicle that costs 1/100th that of a car but lasts 1/100th of a car’s lifespan actually costs the same amount on a monthly basis as a car itself. And also, that the vehicle-miles-traveled of gig workers driving around in their cars to reposition the vehicles and charge batteries may be far more than any of us imagine. I am quite curious just what the ratio is of staff car miles to customer bike/scooter miles in these bike/scooter share systems, but if the figure is not small, then the cost of a bike/scooter rental becomes largely determined by the cost of paying people to drive around in their cars, just like is the case with taxis. It is also possible that the relatively high accident rate is driving up Lime’s insurance costs, and that could be a factor too.
This also begs the question of just how green these bike/scooter share systems really are. While it may look very green for the customer, if the vehicles are constantly getting thrown out, sent to landfills, and replaced every couple of months and every two miles a bike/scooter gets ridden induces a mile of car travel in some gig worker’s gas guzzling SUV, it is not hard to imagine the carbon footprint of bike/scooter share actually being higher than similar trips taken in taxis, particularly if the taxi vehicles can be forced by regulation to be electric or hybrid while the gig workers’ cars cannot. Whatever it is, I’m sure the carbon footprint is far lower when the user simply rides their own e-bike or e-scooter instead.
Yeah, this is the analysis. The high cost really points to the idea that… these services probably aren’t doing a lot of the things that make bikes worth supporting.
Solid analysis. Since at least 2020 I haven’t taken shared bikes or scooters in groups because of the pricing issues. It is still probably worth adding the harder to quantify value of people not adding to the city’s car traffic by taking a taxi. I would much rather see people who don’t have their own bike riding on the Burke vs taking an Uber/Lyft on their way to gas works!
It’s a little hard to look at the profitability and sustainability of the business without more numbers. In particular, “each company is required by city rules to offer a low-income plan”, so it’s unclear what percentage of rides are paying full fare.
The Power BI data, if you click through in the link in the article, does indicate that there are 81k active riders each month, which is relatively small as a percentage of the population, especially if that includes non-residents like tourists. I’d love to see more detailed data on who rides.
It’s clear that these work fairly well in dense, flat, urban areas, especially in Europe or with year-round good weather, for point-to-point last mile transport, especially for younger people.
Seattle is hilly and rainy, so it’s a more challenging environment. I’m not sure what’s going to happen with them here, but I do think it’s a tough business for Seattle. I wouldn’t say it’s worth subsidizing here if those subsidies come from money that otherwise would fund bus and light rail.
100% agree with DB. I would much rather a person use a lime bike/scooter than a car/taxi. Not only for environmental purposes, but for urbanism in general. One less car on city roads is a win. I have used Lime bikes for when I’ve have to pick up my bike from the bike shop or drop my bike off. This gives me a quick, easy way of getting home or to the shop. My time (not having to wait for a bus or taxi/Uber) is worth the cost of the the lime bike trip.
Thanks for pulling this data together and illuminating it Tom. I remain disappointed that neither the share equipment companies, nor my costly local government can tell anyone how many, if any, automobile trips are avoided by share equipment trips. As you point out, having my own equipment, I am not the customer for these things. My anecdotal observations suggest the utilitarian fraction is very small. Having junk left on sidewalks all over town, including across many ADA ramps seems like a steep price to pay unless there are measurably fewer automobiles on Seattle roads. The Parisians may be on to something with their recent vote to ban dockless shared equipment.
On how many auto trips are avoided, there’s a tidbit in the study this blog pointed to earlier:
“Scooters are often used for relatively short trips, with an average trip length of 15 minutes and 1.4 miles.”
https://www.seattlebikeblog.com/wp-content/uploads/2022/05/ScooterShare_Pilot_Report_Final.pdf
So, scooters are used for very short trips, just 1.4 miles on average. I’d guess that means they probably aren’t replacing many car trips, but might be replacing walking or bus trips. Anyway, that study does have a lot more details on scooters in particular if you’re looking for that.
One thing that’s interesting in the data is how extremely usage is concentrated downtown. Every time the current bike/scooter-share systems are mentioned the legacy of Pronto re-enters the discourse. And… back then a lot of Pronto’s skeptics within the bike community thought they were wrong to focus on downtown, saying that getting to Fremont should have been one of their highest priorities, or even that downtown should be completely abandoned in favor of a Burke-Gilman-focused system. I was a pretty big skeptic of Pronto and remain a critic of their legacy, but that’s something they got right. I thought that with the number of stations they had the budget to build their best strategy was to be more downtown-focused, sacrificing the UW outpost for greater density of stations and bikes downtown, and … I look at the heatmaps we’ve got now and I sort of have to claim my award of One Internet Point for that take.
Really the usage is so downtown-focused that I should give my One Internet Point back. I thought that connections to the UW Link station and rides up to Fremont would do better. One of my criticisms of Pronto was that it launched so early and failed so quickly that it never got to take advantage of the Westlake Cycletrack or UW Link. But the heatmap suggests that stuff was never going to matter. People are using bikeshare for short trips, short enough that even with high per-minute rates they’re only a little more expensive than waiting for the bus, and only when their own wheels aren’t an option. That’s very downtown-specific.
At the end of a weekday, there is often a big pile of bikeshare at the seaside end of the pedestrian bridge to the WSDOT ferry terminal. I’m assuming ferry commuters are driving to the ferry terminal islandside in the morning, then using bikeshare to get to and from their downtown offices. This does seem like a good use case for bikeshare. I assume a ton of tourists and cruise ship passengers are also using them. When I’m downtown I’ll often see people riding recklessly on bikeshare on random downtown streets like 5th, not aware of the existing bike lanes on 2nd and 4th, so clearly not local.
I’ll add myself to the thumbs up pileon for basically everything asdf2 said in their analysis. I’m also really skeptical about how “green” this whole thing is, with all the e-waste, fuel use, and replacement waste being generated by these bikes. I’m not poor, but it’s still feels worth it to me every time to haul my bike on a bus from Lake City and on a crowded Link train, just to have it available for my last-mile connection at my destination. This is what bike share should be for, and it should be competitively priced to do so, but it’s not.