Biking is getting gradually safer in Seattle with the rate of collisions involving people on bikes per bike commuter dropping to a new low point in 2018, according to the annual Seattle Department of Transportation Traffic Report.
The report, released two weeks ago, does not include any 2019 data. It offers a detailed look at transportation trends in the city, including safety. Here are the streets where collisions involving people on bikes occurred:
And here’s a map of the year’s serious injury and fatal collisions: (more…)
People sometimes argue that Vision Zero is unrealistic. That getting to zero deaths and serious injuries due to traffic collisions will never happen.
Tell that to Oslo. The Norwegian capital (population: 680,000) had just one person die in traffic in 2019 when a person crashed their car into a fence, according to Aftenposten (translated). This is down from more than 40 in 1970 and an average of 10 to 15 per year in the early 2000s.
This makes me happy:
Road deaths in Oslo (pop. 673.000) in 2019:
Pedestrians: 0 Cyclists: 0 Children: 0
The graph shows the reduction of road deaths since 1975.
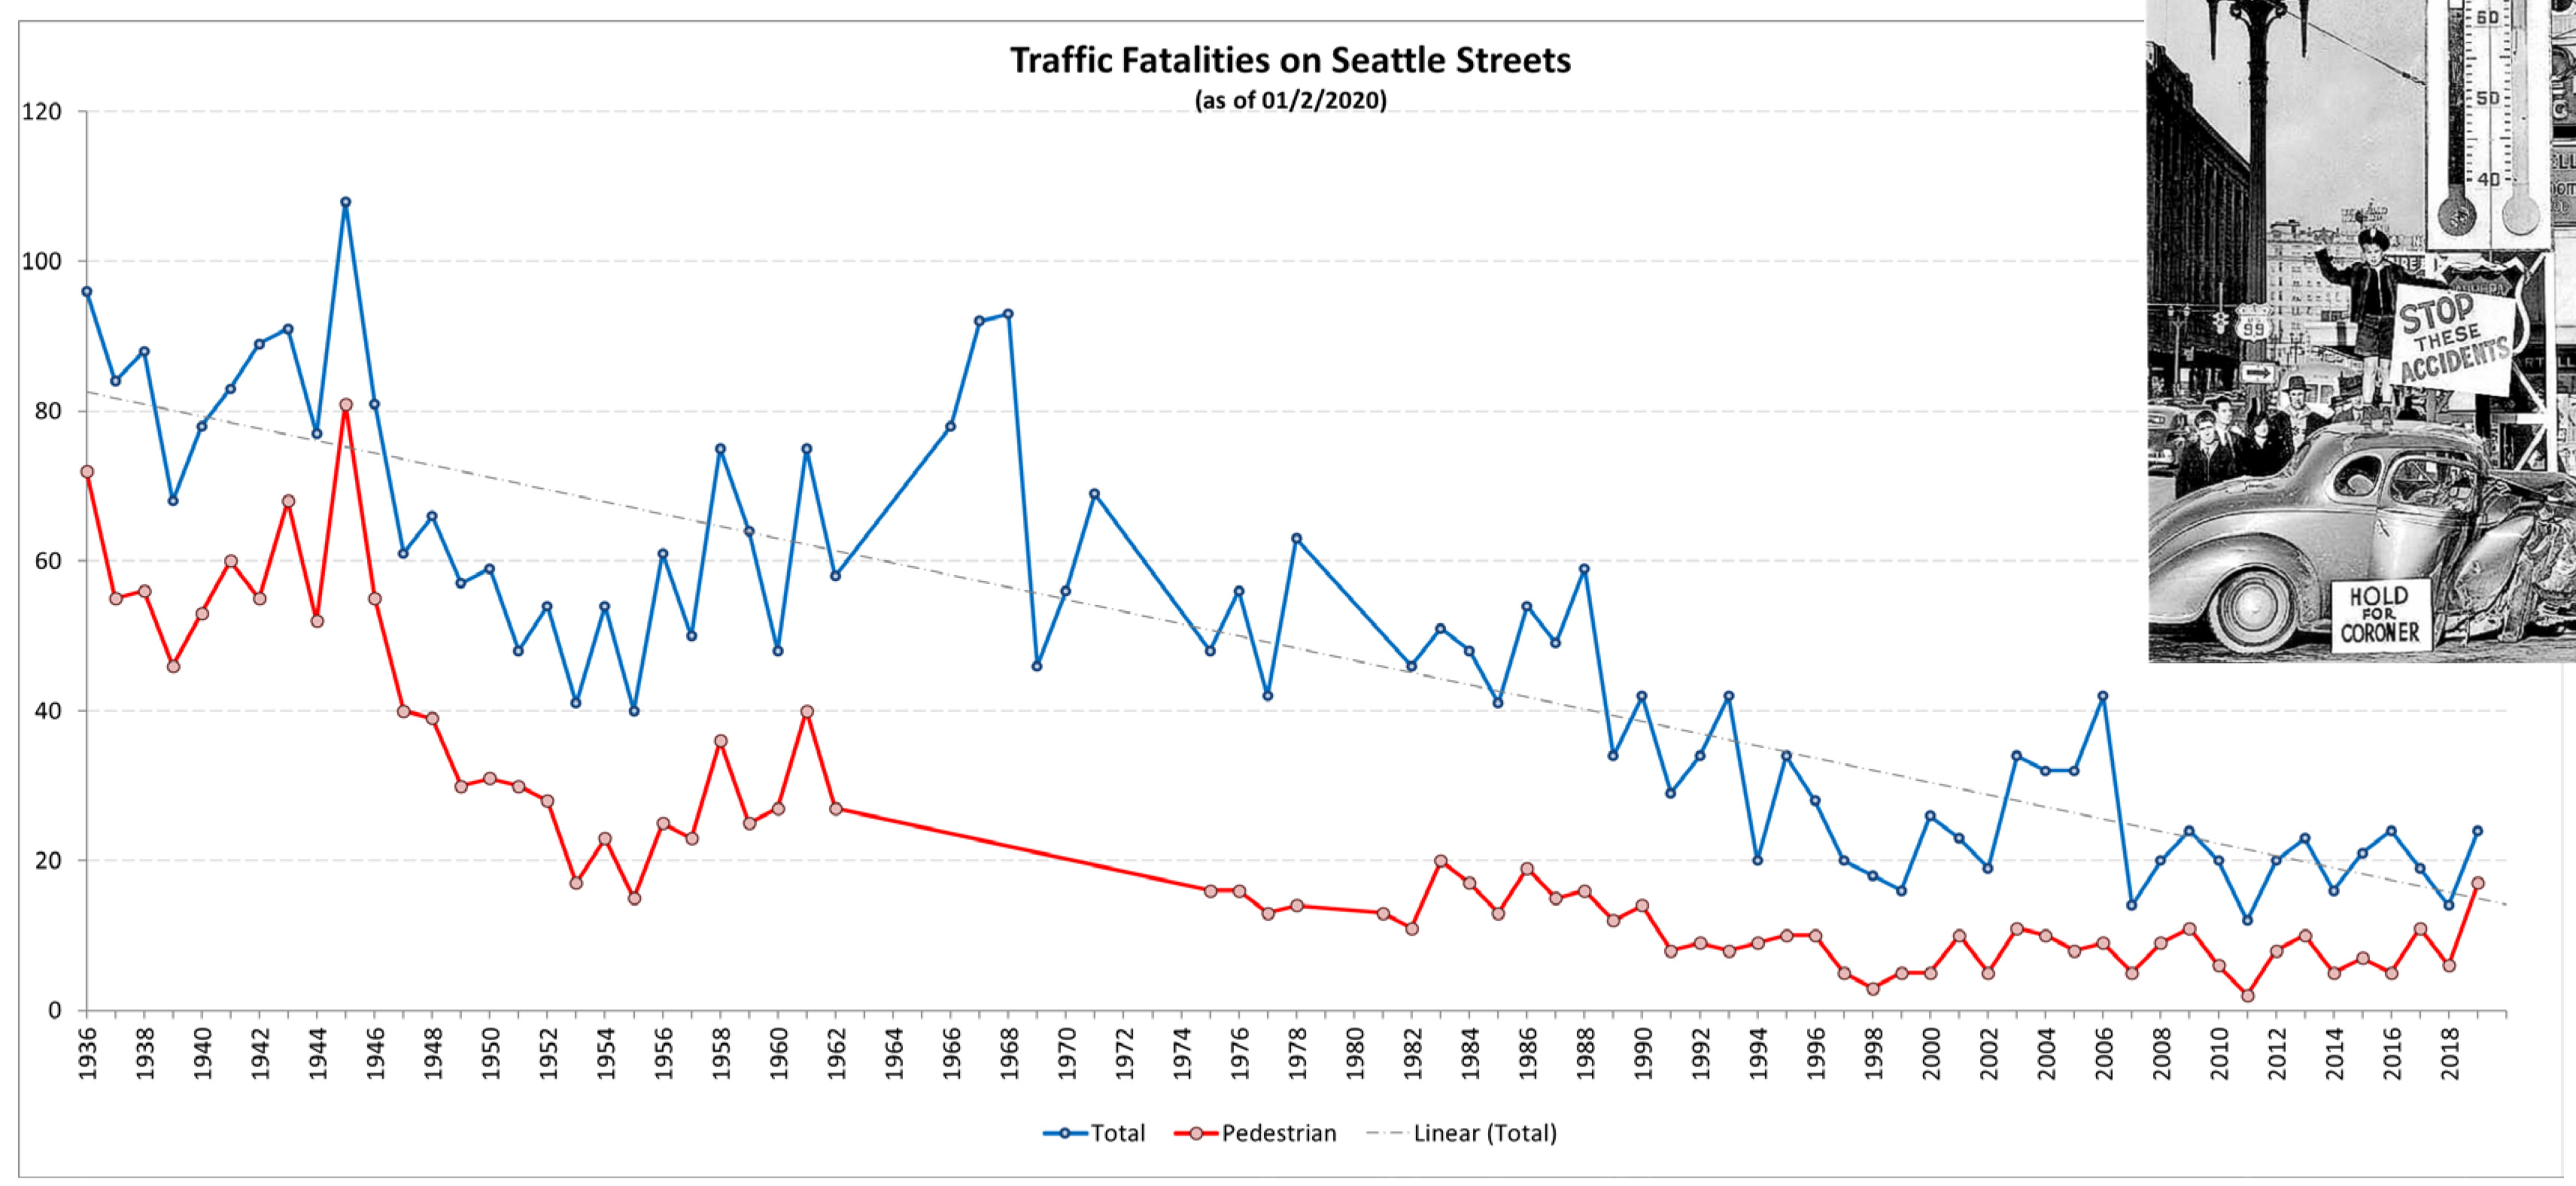
Seattle’s traffic death count in the past decade is similar to Oslo’s in the 90s and early 2000s. But in 2019, our city took a big step in the wrong direction while Oslo went the other way. Early counts put Seattle’s 2019 at 20 or more people, though the official count won’t be in for a while.
From an SDOT Vision Zero presentation (PDF) to the Bicycle and Pedestrian Advisory Boards.
Seattle is a leader in safe streets among large U.S. cities, but that’s an unfortunately low bar. In order to approach zero traffic deaths by 2030, one piece of the city’s Vision Zero goal, Seattle needs to do in 10 years what Oslo did in 20. This is not impossible, and it doesn’t require any magic. Instead, it requires a dedication to safety as the city’s true top transportation priority, significant investment in safe streets infrastructure and efforts to significantly limit the number and speed of cars, especially in our busy business districts.
But that’s not all. Oslo has also been pushing hard to reduce car use to near zero in its city center. Like in Seattle, cars are Oslo’s most stubborn source of greenhouse gas emissions. A recent plan to ban cars entirely from the city center was scaled back following backlash, so the city instead banned on-street parking and has been working to pedestrianize downtown streets.
Sound Transit’s downtown light rail service restriction started this week, and people with bikes must exit trains at International District/Chinatown Station northbound and University Street Station southbound.
The good news is that SDOT completed the south downtown bike connection in time to help riders get around the closure, and it’s really great. But you don’t have to take my word for it. Robert Svercl created this video with friends Bri and Nick to walk you through the whole process from train to train:
People bringing a bike on the train into or through downtown will need to do this for the next ten weeks into March as Sound Transit works to connect the East Link tracks to the existing line. In order to avoid a long complete closure, Sound Transit is essentially single-tracking trains in and out of Pioneer Square Station. So trains arrive at the station, passengers cross a new temporary center platform to swap trains, the the trains reverse and go back the way they came. Bikes are banned because that center platform gets really crowded during the swap: (more…)
UPDATE: I have updated some of the data in this post with official numbers from SDOT. An earlier version of this post had data from data.seattle.gov that for some reason didn’t match with SDOT’s official numbers. As of this update, much of the data.seattle.gov figures now match SDOT’s numbers. The 2nd Ave section of this post has been changed most dramatically.
The counts are in, and Seattle didn’t just see increases in biking, the city absolutely smashed all previous biking records. We leveled up.
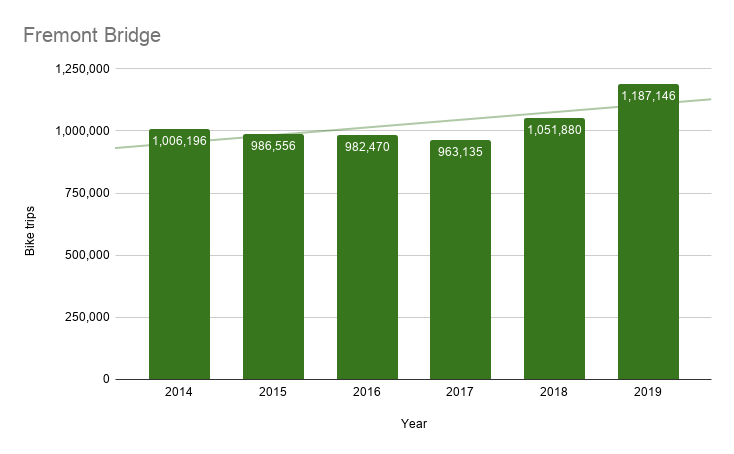
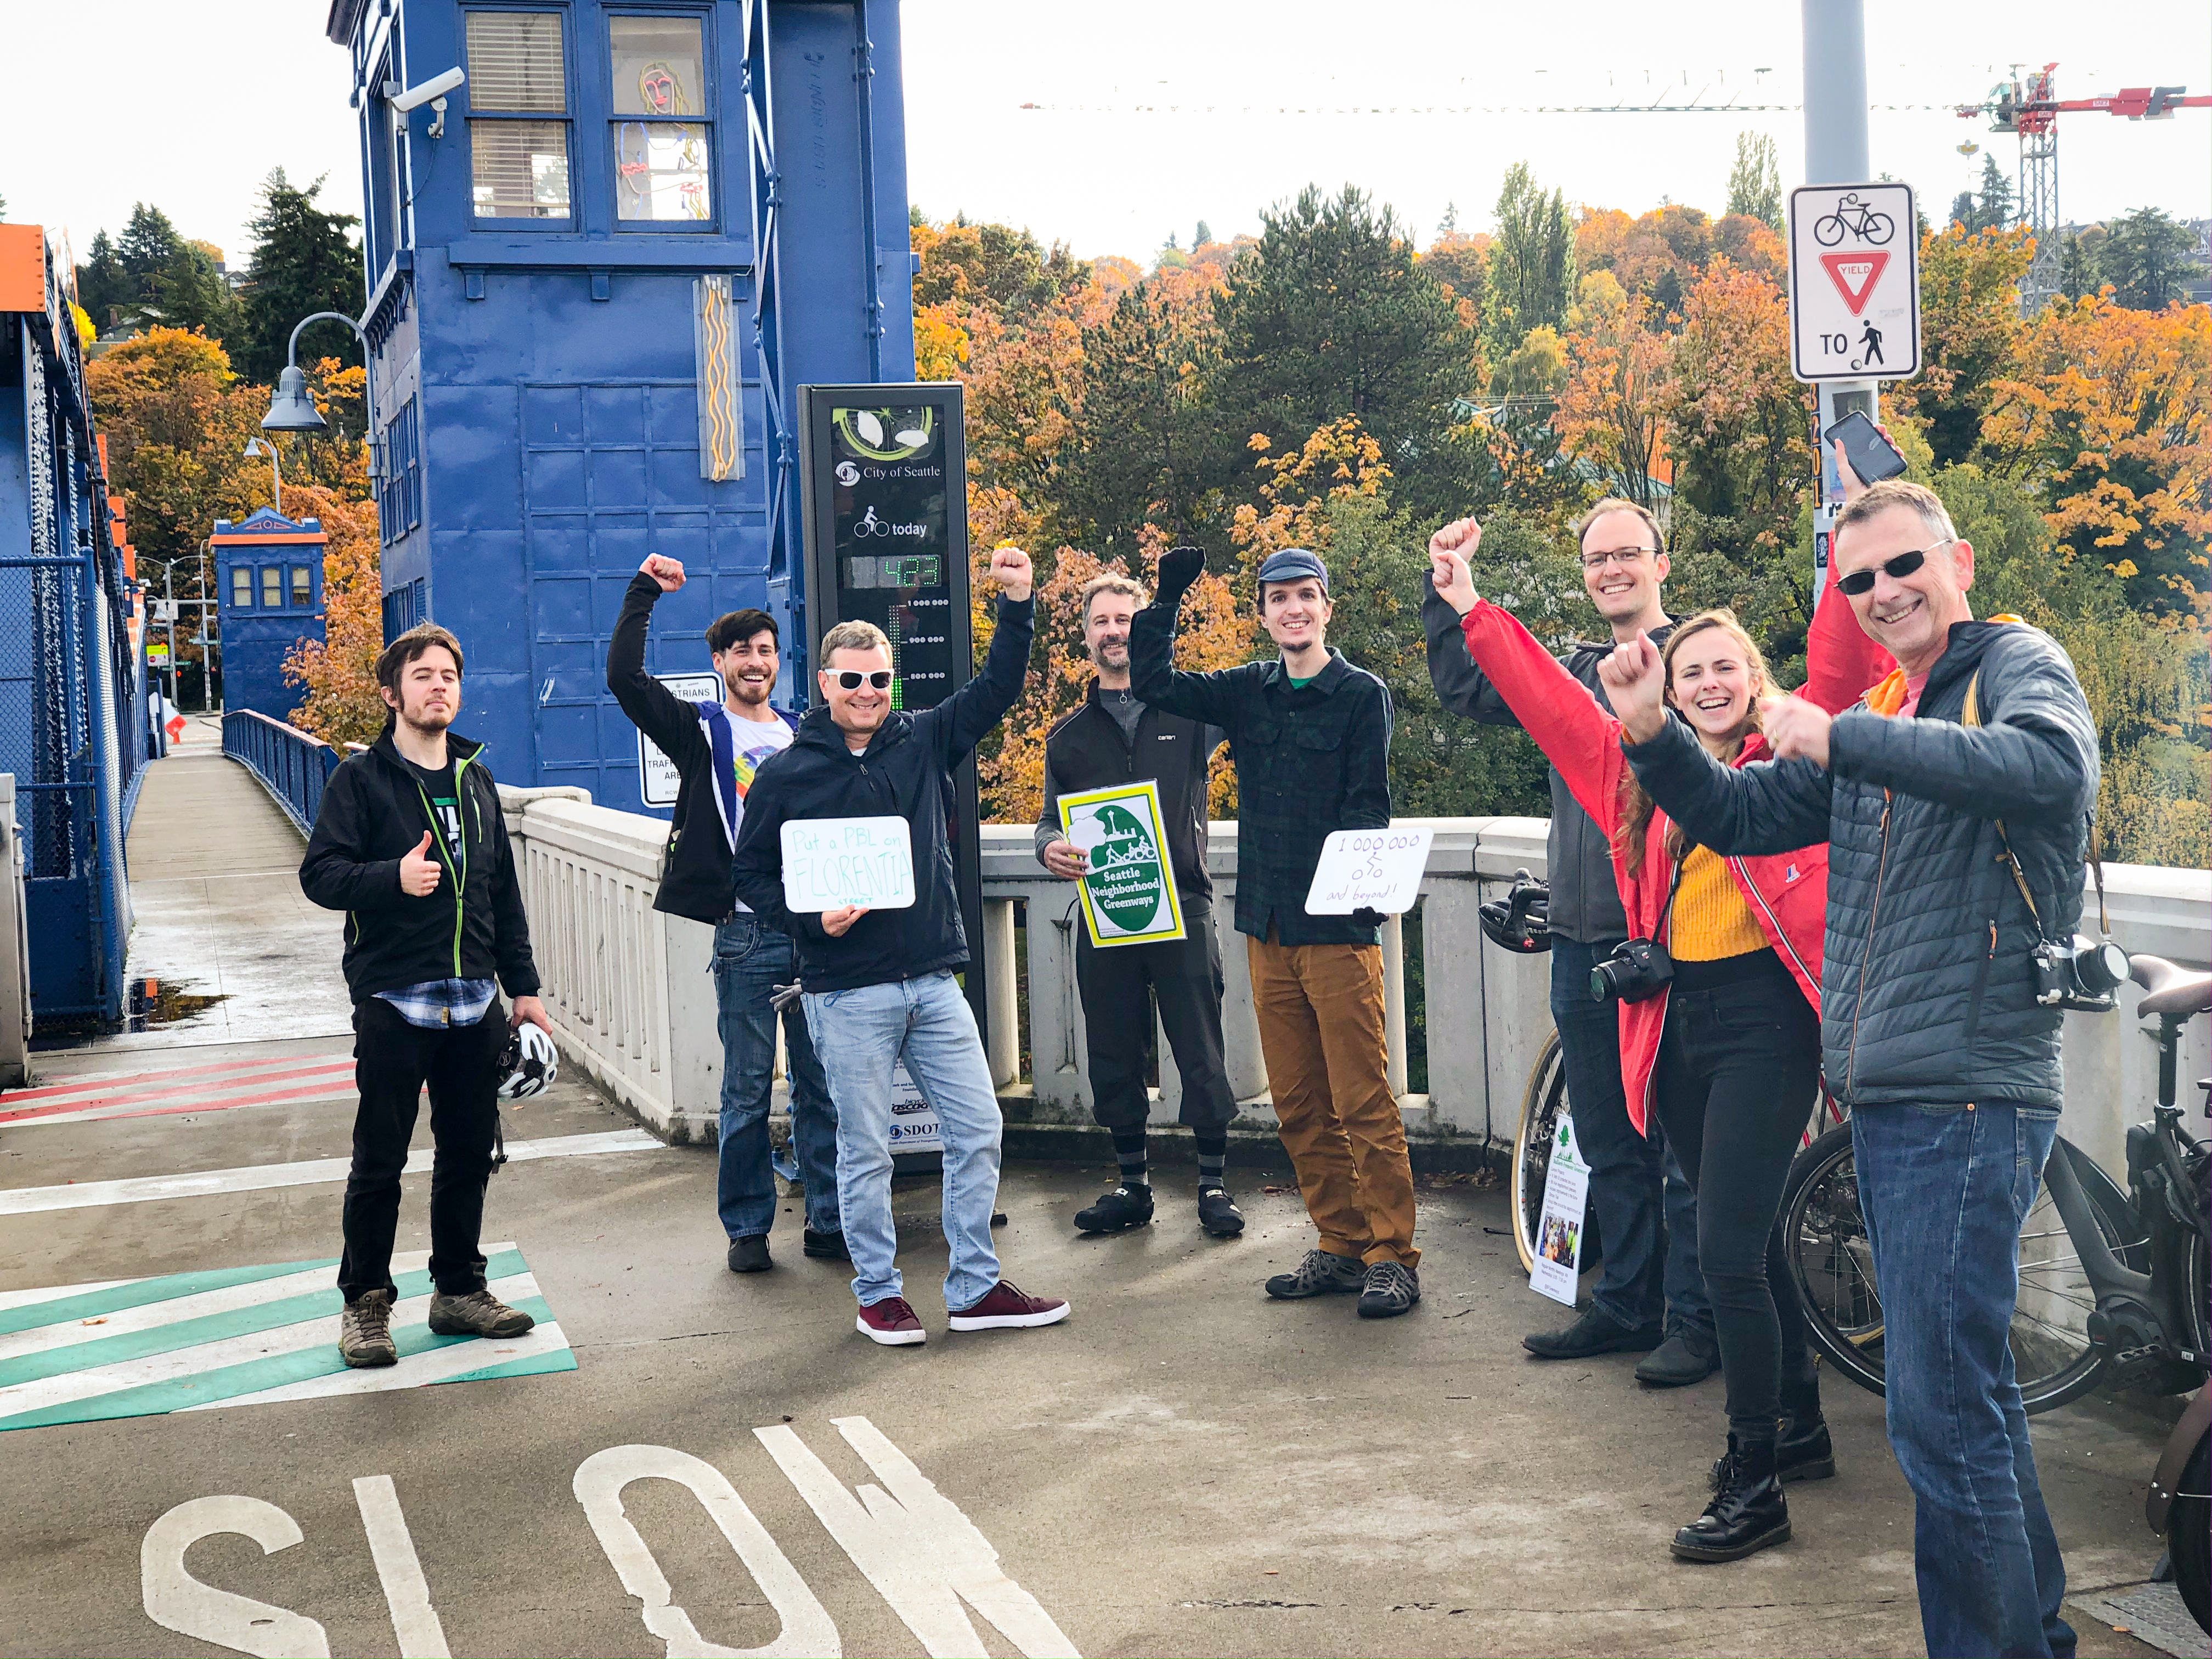
We’ve already written several times (and even made a video) about what happened this year on the Fremont Bridge. So many citywide and regional bike routes converge at this bridge that it sees the highest counts of any other single counting point in town. So it is an exciting point to track.
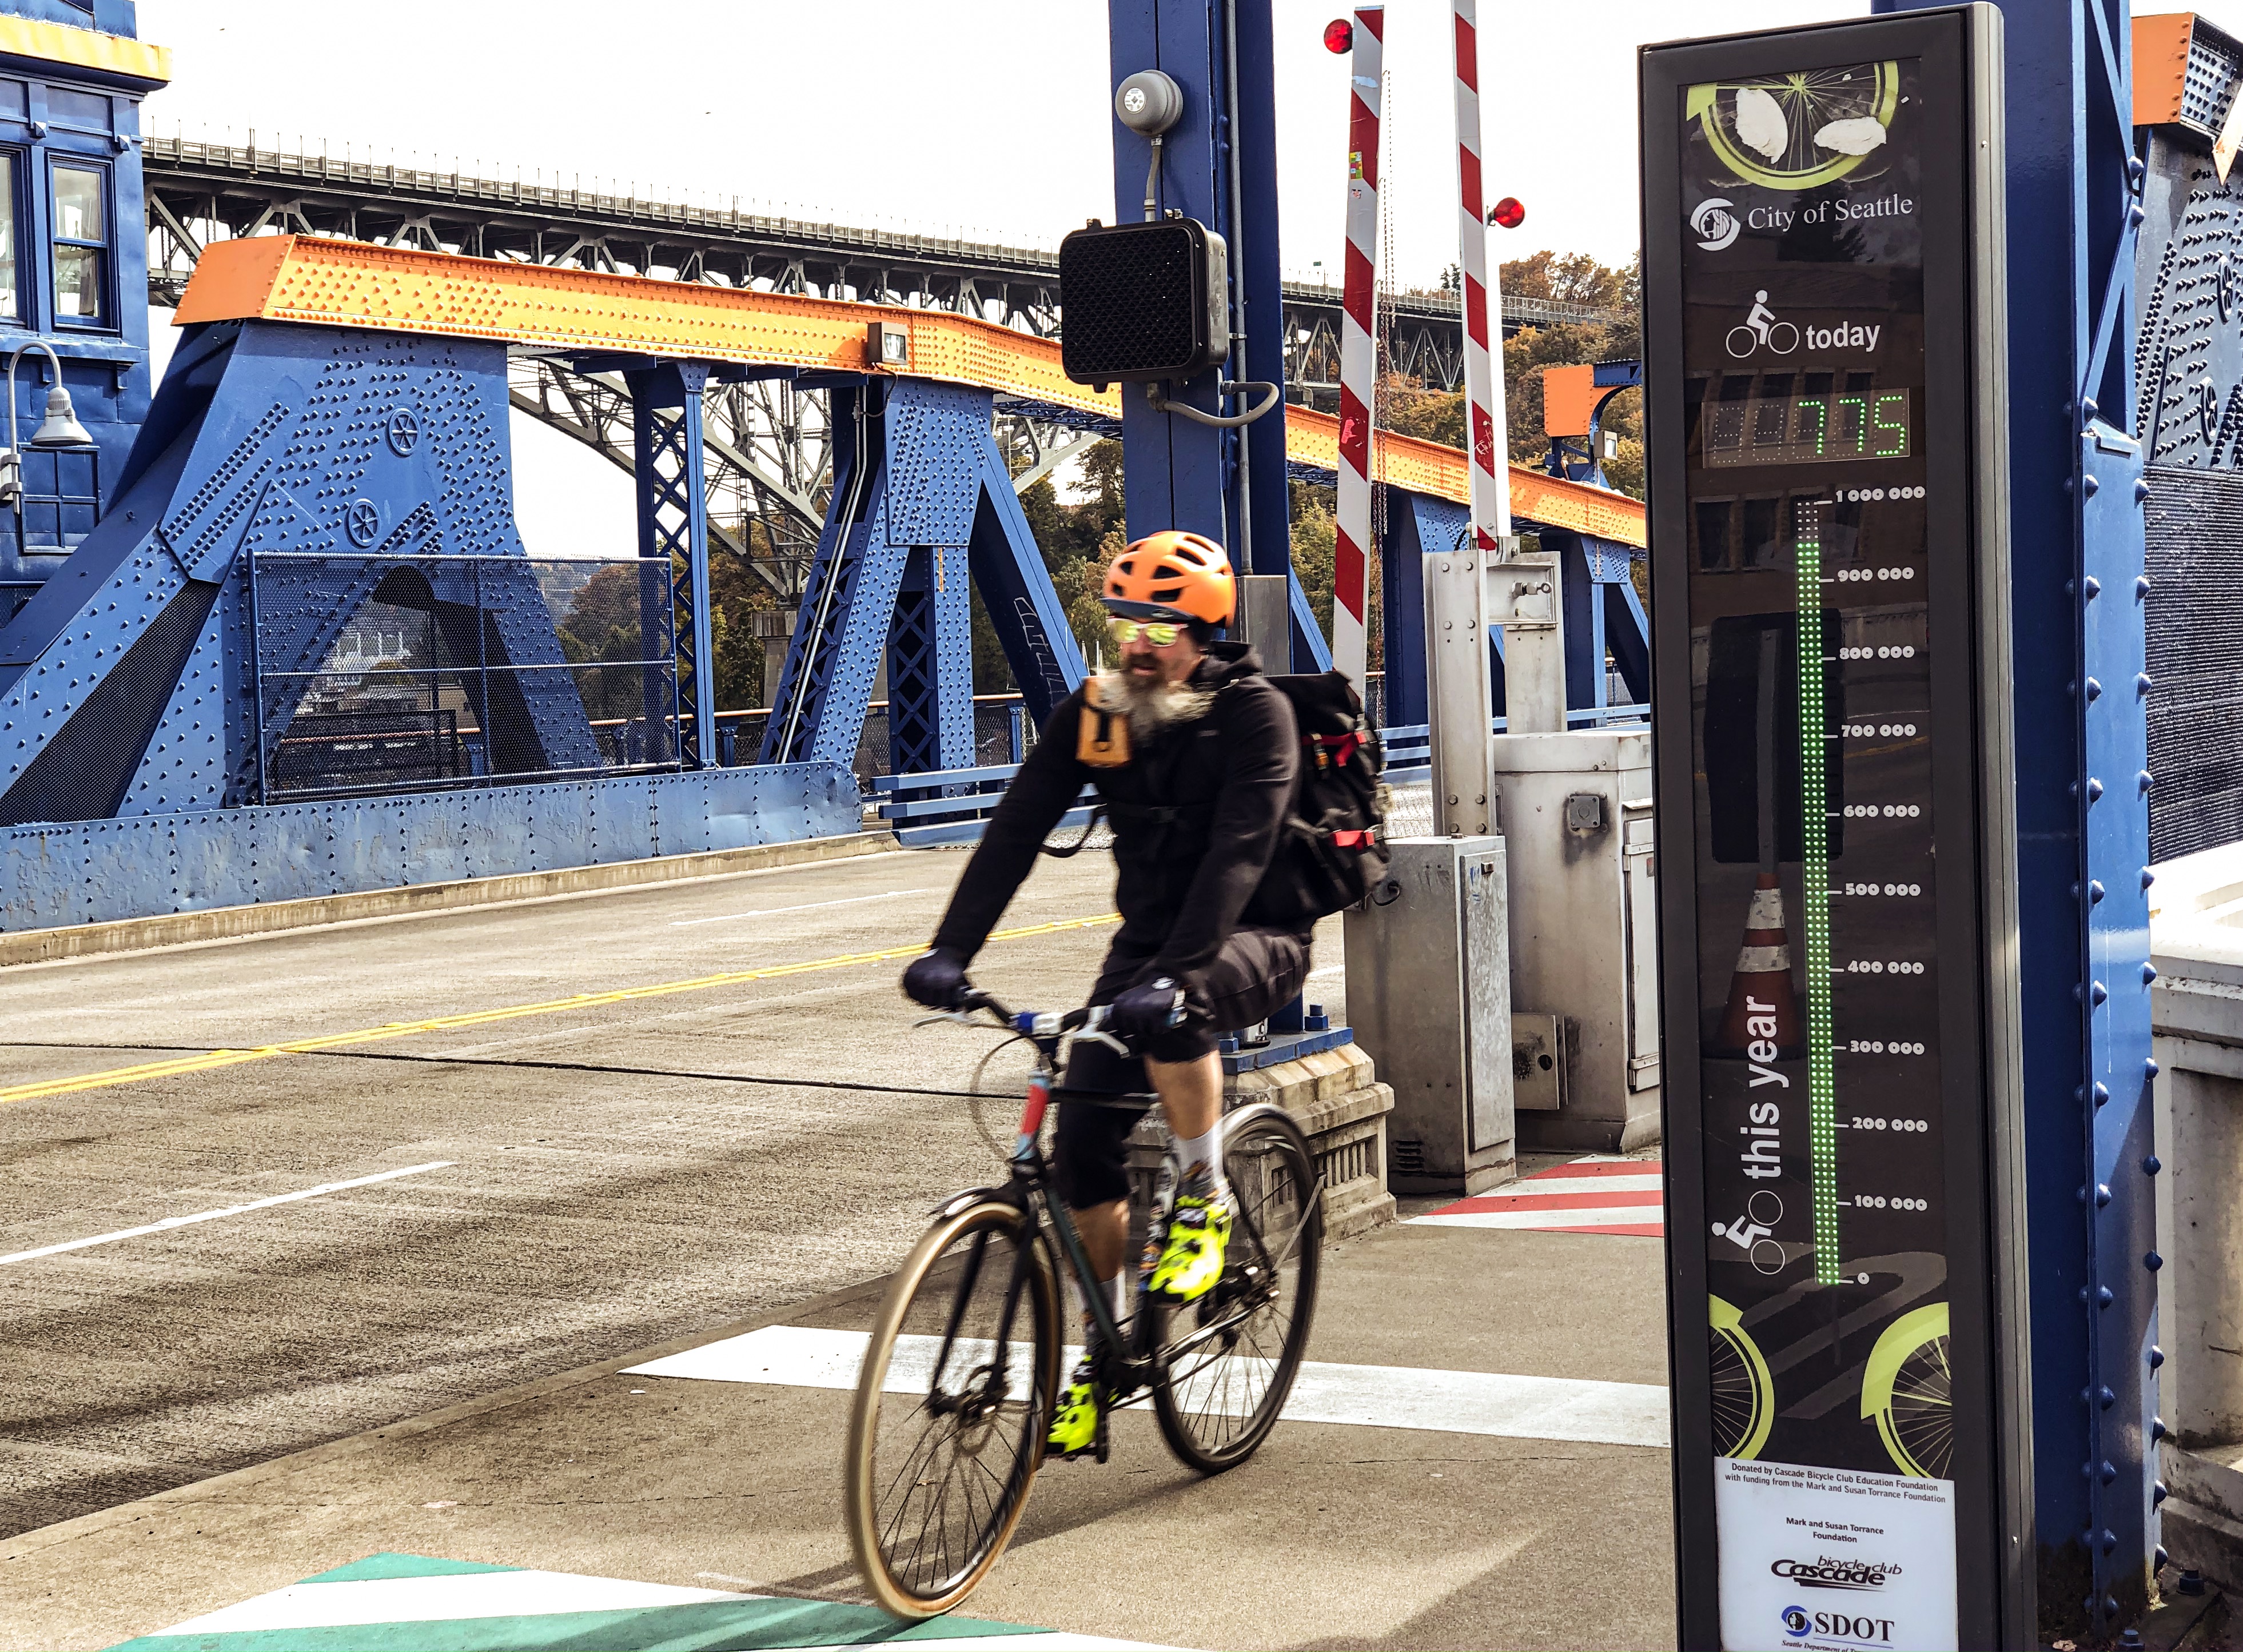
And the physical display ticking away in real time helps give people the feeling that they are part of something bigger. A number readout shows the counts that day while a thermometer-style gauge tracks the counts for the calendar year. Though perhaps Cascade Bicycle Club made a mistake in 2014 when they donated a counter that only goes to 1 million because Seattle topped out in October this year, months earlier than ever before. The grand total: 1,187,146.
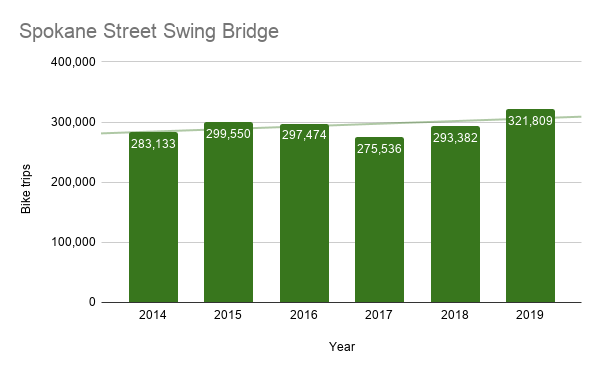
So I wondered, was this just a Fremont Bridge or North Seattle thing? Unfortunately, we don’t have high quality data from all parts of the city. SDOT installed many low-budget counters years ago that have since gone dark due to vandalism or mechanical failure, so they are of little help. But we do have six counters in the city that are ticking away and have what should be mostly consistent and quality data (though it is harder to trust counters that don’t have the real-time displays, which also help make sure people are counted properly). The charts in this post use information directly from data.seattle.gov SDOT, and I did look for major data gaps (at least a month in duration) so I could note them. I also removed the walking counts for the counters that track both walking and biking (though, hey, someone could have fun analyzing that data, I’m sure). Let’s take a look.
It’s time for the final Bike News Roundup of news from the 2010s!
First up, if you didn’t catch Angie Schmitt’s recent talk about America’s pedestrian safety crisis, Rooted In Rights was there to record and stream it:
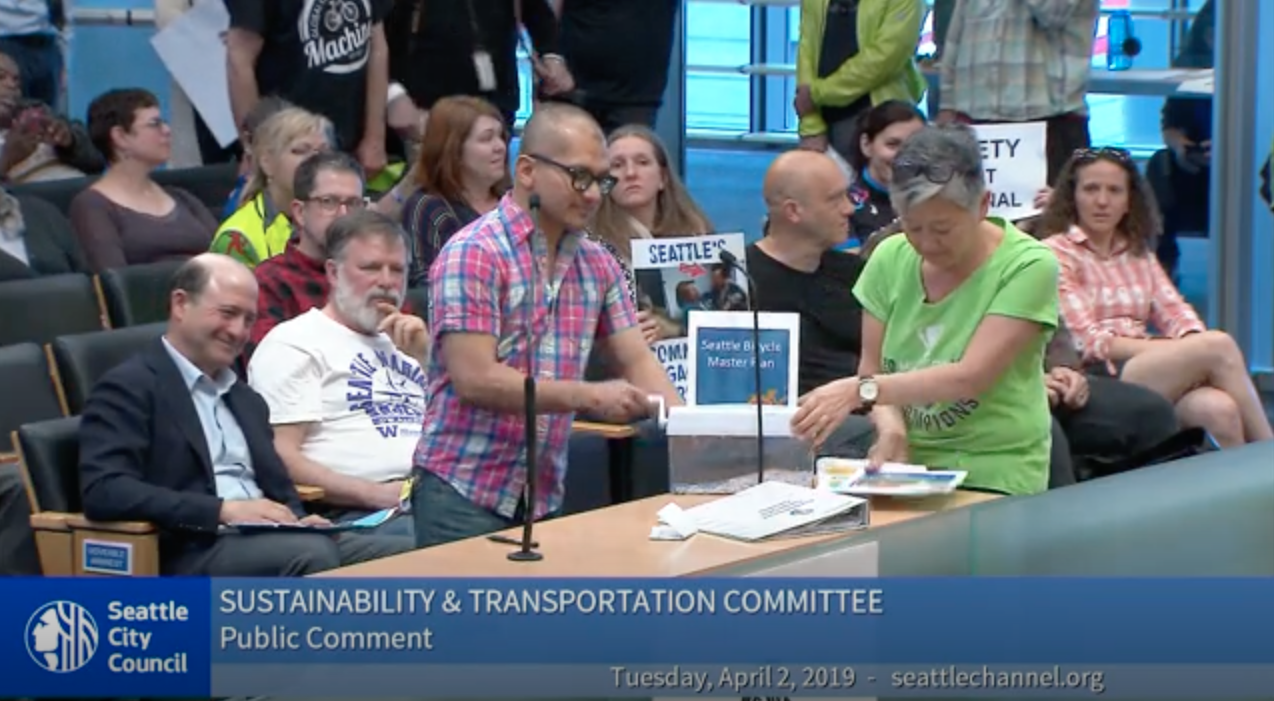
In early April, Tamara Schmautz and Apu Mishra brought a hand-cranked paper shredder to the podium and proceeded to shred the cover sheets to the Bicycle Master Plan, Vision Zero Plan and Climate Action Plan.Cheering people on to celebrate 1 million 2019 Fremont Bridge bike trips in October, a new record.
2019 was a red letter year for biking in Seattle. The number of trips people are taking by bike broke through some kind of barrier in the past year, and bike counters across town are clobbering previous records (we’ll have more on that in the new year when the final numbers are in, so stay tuned). So some combination of bike network improvements and bike share and e-bike sales and bike culture have all worked together to make 2019 the bikiest year in Seattle history.
But back in the spring, it hardly felt like this would be a successful biking year for Seattle. Despite signs that the city’s bike investments were working, Mayor Jenny Durkan canceled the 35th Ave NE bike lanes at the last minute even though they were already designed and contracted for construction. She also released a new bike workplan that dramatically scaled back the city’s previous ambitions, especially in the southend. Her decisions triggered a big backlash and a protest at City Hall as people challenged what they saw as her abandoning the city’s Bicycle Master Plan, Climate Action Plan and transportation equity.
This energy flipped the year around. 2019 started with delays and cancellations, but it is ending with record ridership, major bike lane construction and big political momentum. You all did this.
For her first year in office, there was a lot of uncertainty. SDOT went a year without a Director, and projects were getting delayed. In many ways, Mayor Durkan’s springtime anti-bike decisions reignited popular energy in support of the Bike Master Plan, both for the sake of making biking easier and safer and as a way to combat climate change. The city’s biggest transportation advocacy organizations, including Rooted In Rights, Seattle Neighborhood Greenways, Cascade Bicycle Club and the Transit Riders Union had recently joined together as the Move All Seattle Sustainably (“MASS”) coalition. MASS organized a rally at City Hall and ride down 4th Ave to demand that the city build the biking and safety projects in its transportation plans, including key parts of the downtown bike network like 4th Ave.
The City Council passed a bike safety ordinance all but requiring SDOT to build the projects in the Bike Master Plan during repaving projects. If there are serious reasons why they can’t do so, they need to explain themselves to the Council’s Transportation Committee. This doesn’t guarantee that projects won’t be canceled in the future, but no Seattle Mayor should be able to simply cancel a bike lane project on a whim again. It will require explanation to the Council and the people first.
People also organized to support budget additions for funding key south Seattle projects, including the Georgetown to South Park Trail and a north-south bike lane on either Beacon Ave or MLK. The City Council approved these additions in the final budget. (more…)

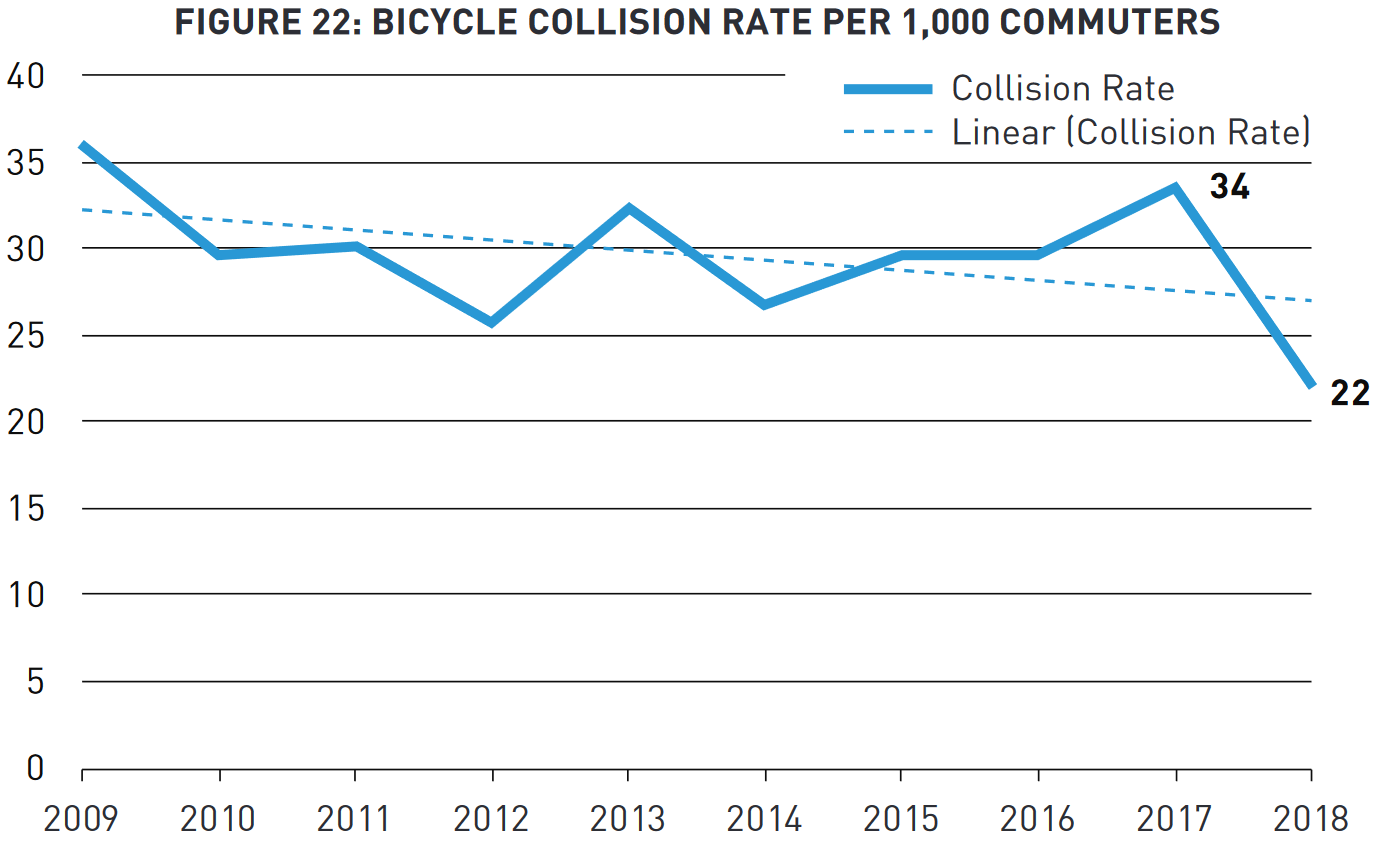 Biking is getting gradually safer in Seattle with the rate of collisions involving people on bikes per bike commuter dropping to a new low point in 2018, according to the annual Seattle Department of Transportation Traffic Report.
 And here’s a map of the year’s serious injury and fatal collisions: (more…)