— Advertisement —
  • The streets Seattle plans to plow + City site tracks which streets have been plowed recently

    Are you waiting for SDOT crews to clear your street? Well, you should probably check this map to see if they are ever coming:
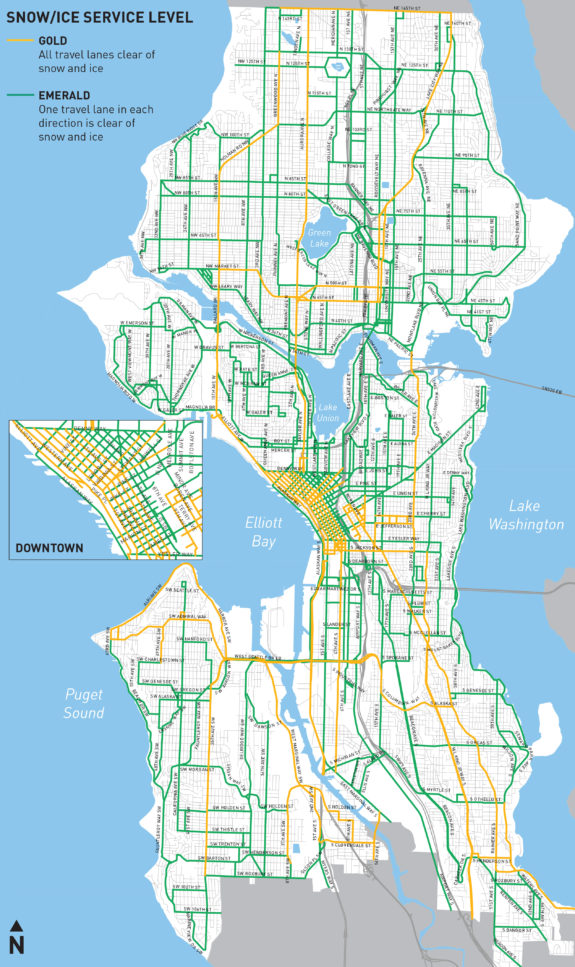

    SDOT weather response map.
    See the map in more detail in this PDF.
    Photo of a cup of coffee with snow and a bicycle in the background.
    My “office” today.

    SDOT also has an interactive map that will be updated to let you know which streets have been cleared recently.

    The snows so far have not been completely debilitating to travel in Seattle proper, though the Eastside and some areas north of Seattle have had a lot more snow. But a night in the 20s froze a lot of side streets and sidewalks early Tuesday. There were some sketchy moments biking across Wallingford, though it wasn’t too bad once I got on the arterial streets SDOT crews had cleared. You still need to be on the lookout for slick patches and steer clear of metal surfaces like manhole covers and sewer grates.

    Biking in Seattle when there’s snow on the roads can also be a bit harrowing, of course. But it can also be beautiful and fun. And unlike driving, you don’t become a sliding multi-ton block of steel if you lose traction. Just take care and don’t expect to get places too quickly. And be prepared to turn around and go home if it’s not going well (or lock your bike to the nearest bike rack and start walking). When I lived in Denver, a very flat city with powdery snow, I had a pretty good time getting around in the snow on my bike. But add a hill and a layer of ice, and it gets a lot harder. Be careful out there.

    If you really do need to get somewhere and don’t feel comfortable biking, walking and transit are really your best options. But add a ton of time to your expected transit trip, and be aware that many bus routes change when there is snow and ice. So check the King County Metro service alert website to make sure your bus stop is still being served even if you know your bus route is operating (for example, the 5 is skipping Dayton Ave N as of this writing, the kind of change that could happen to your route if there is more precipitation).

    — Advertisement —
  • Funding, legalizing the ‘safety stop’ on WA Bikes’ agenda in Olympia

    Photo of a bike next to a stop sign on a street in Interbay.With voter approval of I-976 hanging over the 2020 state legislative session, there’s no doubt that funding will be the top priority for Washington Bikes this year. Even if courts strike down the law, which is very possible, there is a lot of political pressure on state leaders to enact some kind of transportation funding change anyway.

    The stakes are big and largely unknown. What specific funding will be at risk? Biking and walking is a very small percentage of the state’s transportation budget, but that doesn’t mean it’s safe. From WA Bikes:

    The state’s approach to filling the funding shortfall created by I-976 is still in flux, but one thing is clear: I-976 will require state legislators to make hard decisions this session in order to cover an anticipated and significant hole in the multimodal transportation account.

    The multimodal transportation account dedicates funds for transportation including rail, ferries, transit, biking and walking. It’s the primary state funding source for biking and walking investments and contains projects funded through the 2015 Connecting Washington transportation package, which allocated historic levels of funding for bike and pedestrian infrastructure, as well as Safe Route To School, Bike and Pedestrian grant programs, and the Bike and Pedestrian project list.

    And state law also governs what kinds of revenue local governments and agencies can collect, so changes could impact SDOT, King County Metro and Sound Transit even if the lawsuit is successful. But beyond current budgets, Seattle and King County are both due to run Transportation Benefit District renewals this year, and state law outlines the revenue options for these vital packages. Seattle’s Transportation Benefit District currently relies heavily on vehicle license fees and largely funds transit service. At a time when we need to continue going big on transit service, walking and biking to continue growing our ridership, we need powerful options to offer voters. Our investments are working, we can’t go backwards now.

    The ‘safety stop’

    (more…)

    — Advertisement —
  • Where 2018’s bicycle collisions happened + More from the Traffic Report

    Chart showing bicycle collision rate per 1,000 commuters. the trend is down from 2009 to 2018.Biking is getting gradually safer in Seattle with the rate of collisions involving people on bikes per bike commuter dropping to a new low point in 2018, according to the annual Seattle Department of Transportation Traffic Report.

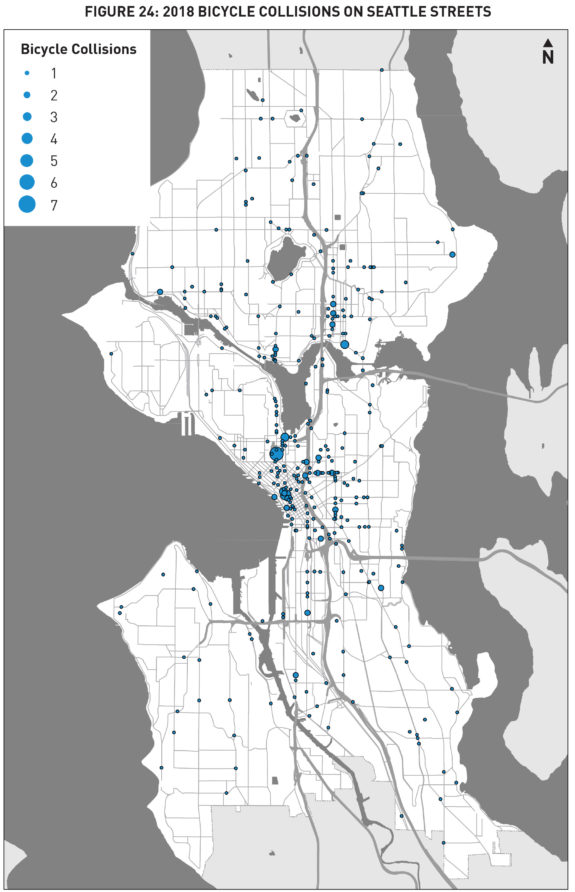
    The report, released two weeks ago, does not include any 2019 data. It offers a detailed look at transportation trends in the city, including safety. Here are the streets where collisions involving people on bikes occurred:

    Map of 2018 bicycle collisions.And here’s a map of the year’s serious injury and fatal collisions: (more…)

    — Advertisement —
  • Shortcut: Only 1 person died in Oslo traffic last year, a city comparable in size to Seattle

    People sometimes argue that Vision Zero is unrealistic. That getting to zero deaths and serious injuries due to traffic collisions will never happen.

    Tell that to Oslo. The Norwegian capital (population: 680,000) had just one person die in traffic in 2019 when a person crashed their car into a fence, according to Aftenposten (translated). This is down from more than 40 in 1970 and an average of 10 to 15 per year in the early 2000s.

    Seattle’s traffic death count in the past decade is similar to Oslo’s in the 90s and early 2000s. But in 2019, our city took a big step in the wrong direction while Oslo went the other way. Early counts put Seattle’s 2019 at 20 or more people, though the official count won’t be in for a while.

    Chart of Saettle traffic fatalities by year.
    From an SDOT Vision Zero presentation (PDF) to the Bicycle and Pedestrian Advisory Boards.

    Seattle is a leader in safe streets among large U.S. cities, but that’s an unfortunately low bar. In order to approach zero traffic deaths by 2030, one piece of the city’s Vision Zero goal, Seattle needs to do in 10 years what Oslo did in 20. This is not impossible, and it doesn’t require any magic. Instead, it requires a dedication to safety as the city’s true top transportation priority, significant investment in safe streets infrastructure and efforts to significantly limit the number and speed of cars, especially in our busy business districts.

    But that’s not all. Oslo has also been pushing hard to reduce car use to near zero in its city center. Like in Seattle, cars are Oslo’s most stubborn source of greenhouse gas emissions. A recent plan to ban cars entirely from the city center was scaled back following backlash, so the city instead banned on-street parking and has been working to pedestrianize downtown streets.

    And it’s working.

    — Advertisement —
  • Watch: Guide to biking around the downtown light rail closure

    Sound Transit’s downtown light rail service restriction started this week, and people with bikes must exit trains at International District/Chinatown Station northbound and University Street Station southbound.

    The good news is that SDOT completed the south downtown bike connection in time to help riders get around the closure, and it’s really great. But you don’t have to take my word for it. Robert Svercl created this video with friends Bri and Nick to walk you through the whole process from train to train:

    People bringing a bike on the train into or through downtown will need to do this for the next ten weeks into March as Sound Transit works to connect the East Link tracks to the existing line. In order to avoid a long complete closure, Sound Transit is essentially single-tracking trains in and out of Pioneer Square Station. So trains arrive at the station, passengers cross a new temporary center platform to swap trains, the the trains reverse and go back the way they came. Bikes are banned because that center platform gets really crowded during the swap: (more…)

    — Advertisement —
  • Seattle’s 2019 bike boom in 6 charts + Where should Seattle’s next bike counters go? – UPDATED

    UPDATE: I have updated some of the data in this post with official numbers from SDOT. An earlier version of this post had data from data.seattle.gov that for some reason didn’t match with SDOT’s official numbers. As of this update, much of the data.seattle.gov figures now match SDOT’s numbers. The 2nd Ave section of this post has been changed most dramatically.

    Photo of a person biking past the Fremont Bridge bike counter, a tall black structure with thermometer-like lights up the front tracking annual totals and a display of numbers counting the day's total.The counts are in, and Seattle didn’t just see increases in biking, the city absolutely smashed all previous biking records. We leveled up.

    We’ve already written several times (and even made a video) about what happened this year on the Fremont Bridge. So many citywide and regional bike routes converge at this bridge that it sees the highest counts of any other single counting point in town. So it is an exciting point to track.

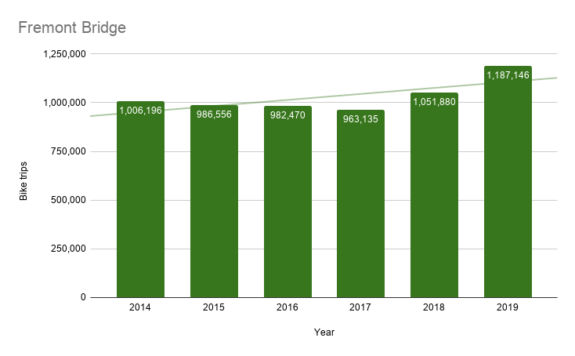
    And the physical display ticking away in real time helps give people the feeling that they are part of something bigger. A number readout shows the counts that day while a thermometer-style gauge tracks the counts for the calendar year. Though perhaps Cascade Bicycle Club made a mistake in 2014 when they donated a counter that only goes to 1 million because Seattle topped out in October this year, months earlier than ever before. The grand total: 1,187,146.

    Column chart showing Fremont Bridge bike counts by year. 2019 is by far the highest.So I wondered, was this just a Fremont Bridge or North Seattle thing? Unfortunately, we don’t have high quality data from all parts of the city. SDOT installed many low-budget counters years ago that have since gone dark due to vandalism or mechanical failure, so they are of little help. But we do have six counters in the city that are ticking away and have what should be mostly consistent and quality data (though it is harder to trust counters that don’t have the real-time displays, which also help make sure people are counted properly). The charts in this post use information directly from data.seattle.gov SDOT, and I did look for major data gaps (at least a month in duration) so I could note them. I also removed the walking counts for the counters that track both walking and biking (though, hey, someone could have fun analyzing that data, I’m sure). Let’s take a look.

    Column chart showing Spokane Street Swing Bridge bike counts by year. 2019 is the highest. (more…)

    — Advertisement —
— Advertisement —

Join the Seattle Bike Blog Supporters

As a supporter, you help power independent bike news in the Seattle area. Please consider supporting the site financially starting at $5 per month:

Latest stories

— Advertisements —

Latest on Mastodon

Loading Mastodon feed…