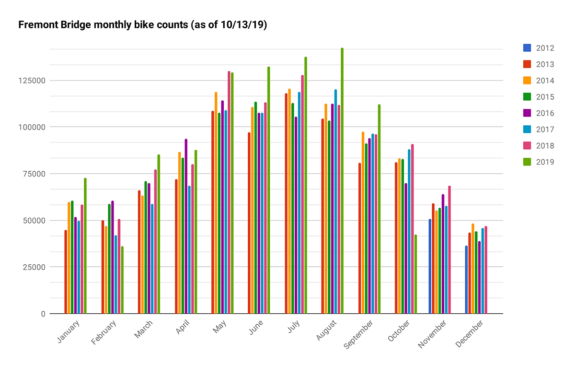
 When the Fremont Bridge bike counter started ticking away in 2012, the big question was: How many years before it measures 1 million trips in a calendar year? It barely hit 1 million in 2014, though that year was a bit anomalous. It narrowly missed 1 million 2015 though 2017 before a big biking surge in 2018 hit the mark around Thanksgiving, itself an incredible feat.
This year, Seattle is on pace to hit 1 million trips before Halloween. With 958,572 trips measured as of October 6 and a weekly pace of around 25,000 we should be about a week and a half away (shorter with great weather, a bit longer if there is sustained heavy rain). But it is almost certain that the Fremont Bridge will reach 1 million before Halloween, a month earlier than the record set last year.
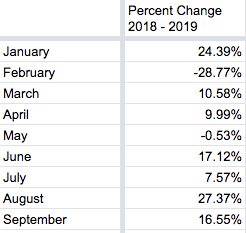
Dockless bike share services, which launched in 2017 and dramatically grew in 2018, are the most obvious force behind the boom in recent years. But the smoke choking the city last summer diminished the counts, as is clear in the 27% increase in August 2019 compared to August 2018.
But smoke is not the whole story. Neither is bike share. Monthly totals have seen significant year-over-year increases in 7 of 9 months so far (only volatile, very weather-dependent February saw a significant decrease). Meanwhile, bike share use is largely the same as in 2018, according to a recent city report. So it seems that in 2019, more people are riding their own bikes more often. Could the clear rise in e-bikes be part of the equation here? Did using bike share convince more people to buy their own bikes? There’s a lot worth exploring here. (more…)


