— Advertisement —
  • A statistical analysis of biking on the Fremont Bridge, Part 4: Are more people biking?

    EDITOR’S NOTE: This is the final post in a four-part series of posts this week by statistician Mike Logsdon. Mike bikes across the Fremont Bridge every day, and put together this analysis of the bike counter data “mostly for the amusement of friends and coworkers.”

    Are More Seattleites Bicycling Across the Fremont Bridge? The short answer: Probably.

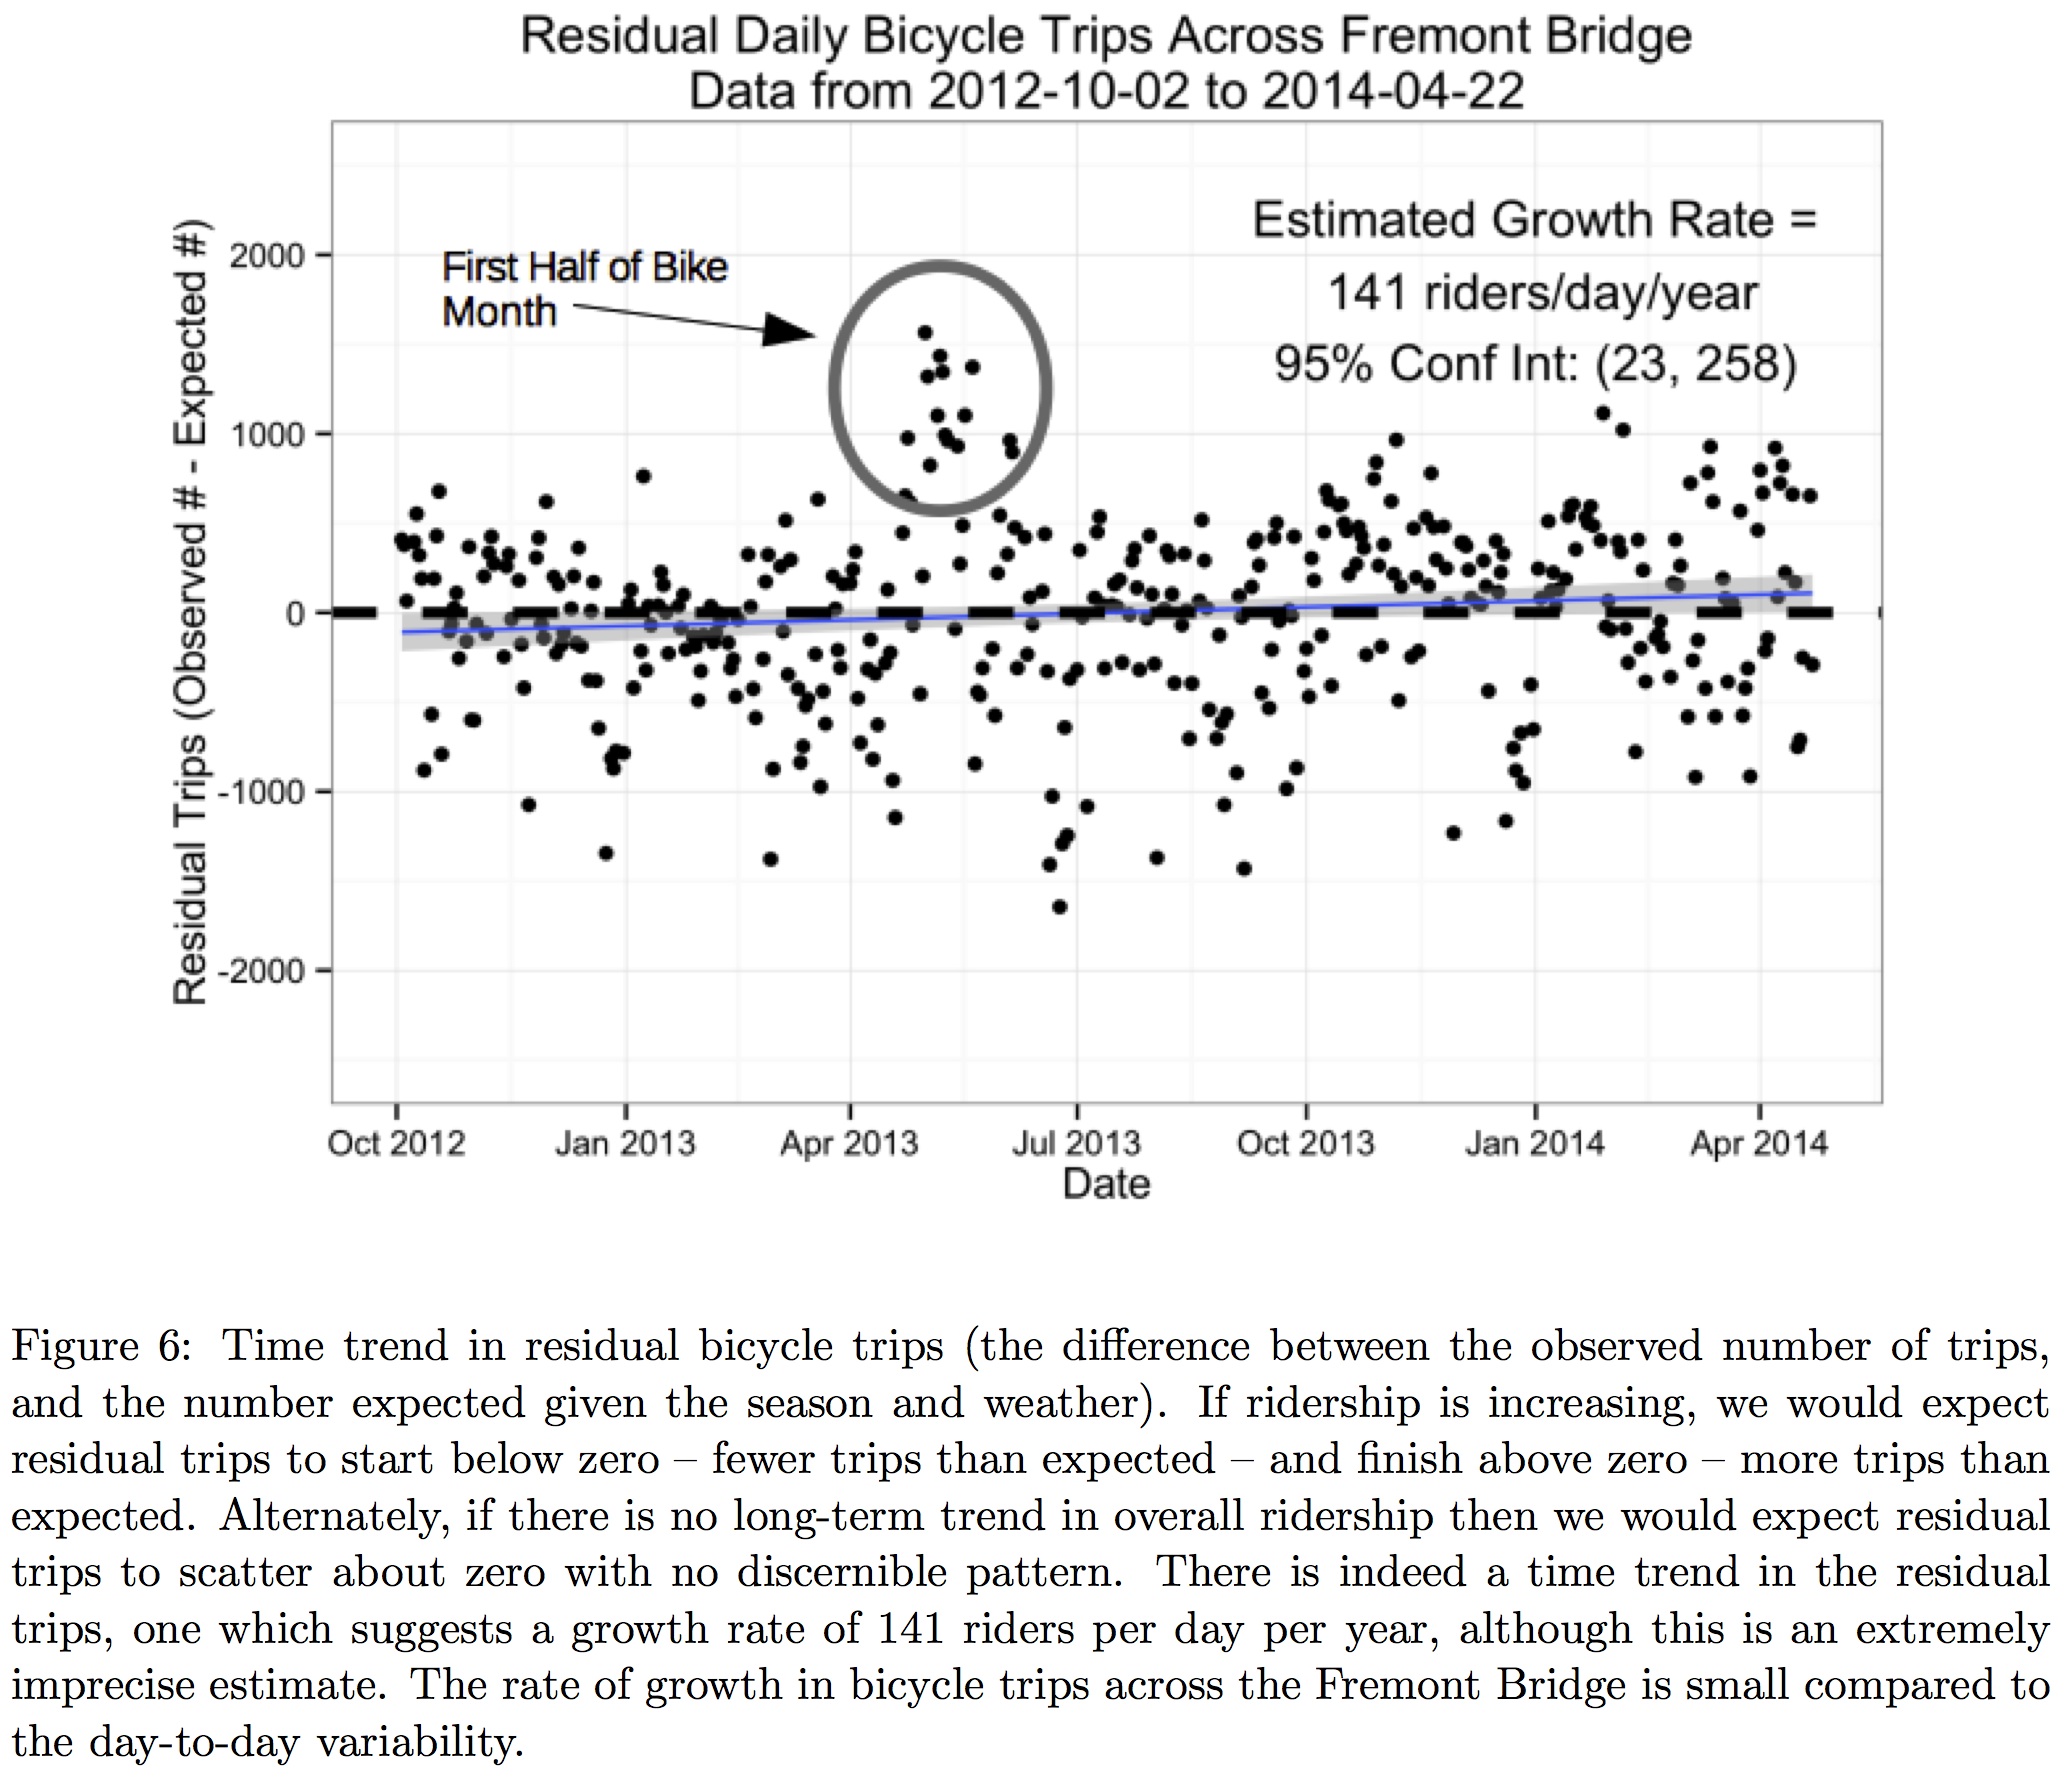
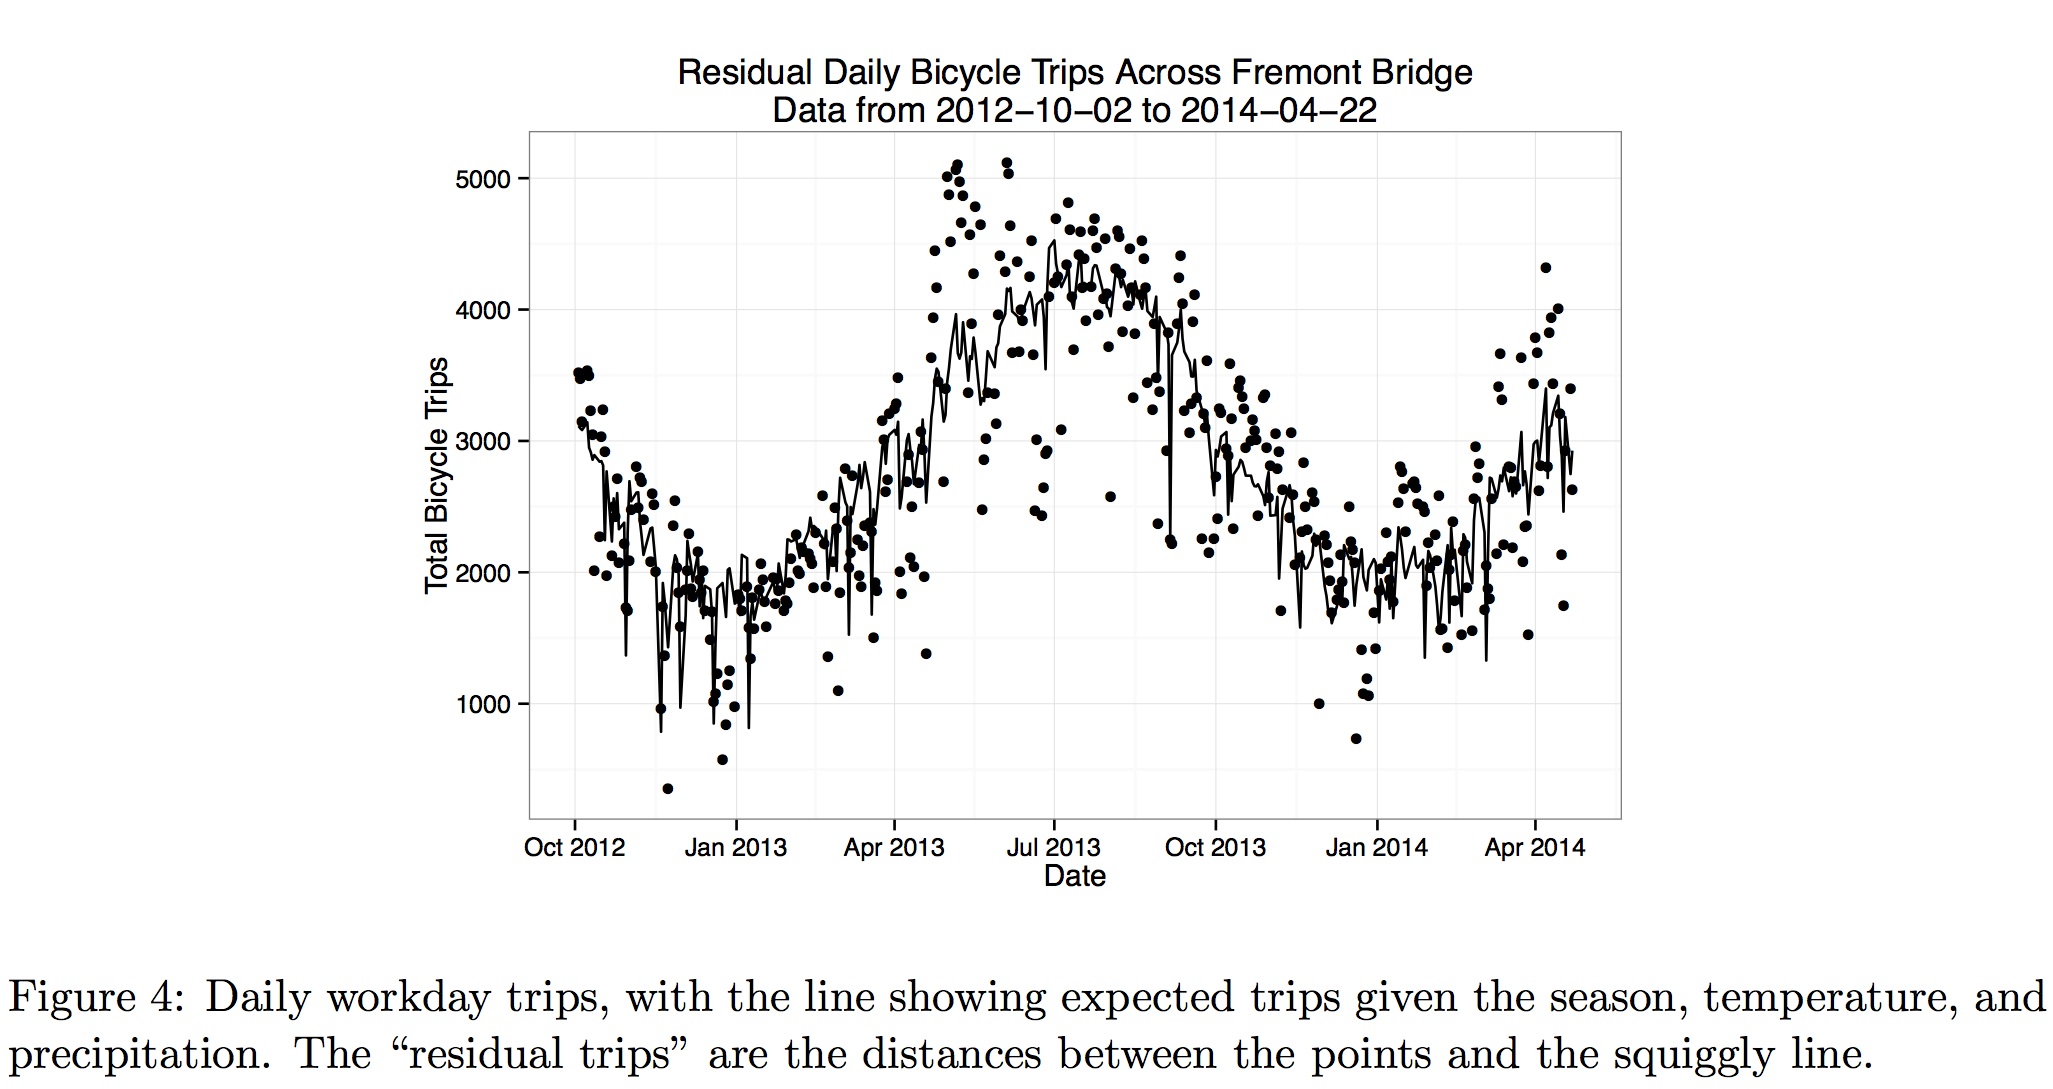
    It’s tough to make any emphatic declarations from 18 months worth of recorded trips, as we have to investigate trends net of seasonal and weather effects. Once again we consider residual ridership — the difference between observed crossings and the number expected given season and weather. Time trends in Fremont Bridge bicycle crossings should manifest themselves as time trends in the residual trips. If daily crossings are growing, then the expected counts will exceed the observed counts at the beginning of the monitoring and reverse at the end of monitoring. If there is no time trend in bicycle crossings, then the residual trips should simply scatter around zero with no pattern.

    Figure 6 shows the residual trips, plotted against date. A slight time trend revealed itself, to the tune of a 140 rider per day per year increase. This estimate, however, is extremely imprecise. Any time trend in ridership is simply small compared to the day-to-day variability in bicycle trips, given the duration of the observations.

    Fremont_Bike-grow1 (more…)

    — Advertisement —
  • A statistical analysis of biking on the Fremont Bridge, Part 3: Bike Month

    EDITOR’S NOTE: This is the third in a four-part series of posts this week by statistician Mike Logsdon. Mike bikes across the Fremont Bridge every day, and put together this analysis of the bike counter data “mostly for the amusement of friends and coworkers.” Note that at the time Mike did this analysis, the 2014 Bike Month data was not yet available. So this post only looks at 2013.

    The Cascade Bicycle Club promotes May of every year as Bike Month. Local businesses sign up teams of bicycle commuters for the commute challenge, and the Cascade Bicycle Club offers a variety of events, incentives, and aid to raise awareness and promote bicycle commutership. Obviously the benefits are numerous to everyone: Bicycle commuting boosts the health of the participants and takes cars off the roads. But how much do these efforts actually modify commute habits?

    To make fair comparisons, we consider “residual” trips. Residual trips represent the difference between the observed number of crossings by bicycle and some expected number given the season and the weather. Intuitively, we expect lots of riders on a sunny day in June and few riders on a rainy day in January, so we need to account for that when making comparisons. A particular week may have seen unusually high rates of bicycle crossings, but perhaps that week experienced unusually pleasant weather. Fair comparisons adjust for the season and the weather, and we do so by fitting a regression model to calculate “expected counts”, then investigate the differences between observed counts and expected.

    If commute rates during Bike Month consistently and emphatically exceed the expected rates, then we can conclude that the Cascade Club advocacy proved fruitful. As a demonstration, Figure 4 shows the daily observed counts, with a squiggly line showing the expected counts. The regression model is the same as that in the previous section, when it was used to estimate the effect of rain.

    Fremont_Bike-month1 (more…)

    — Advertisement —
  • A statistical analysis of biking on the Fremont Bridge, Part 2: Rain

    EDITOR’S NOTE: This is the second in a four-part series of posts this week by statistician Mike Logsdon. Mike bikes across the Fremont Bridge every day, and put together this analysis of the bike counter data “mostly for the amusement of friends and coworkers.” I hope you enjoy it as much as I do.

    Seattleites talk a tough game with the rain. We proudly eschew umbrellas and hoods, and claim not to be bothered by showers and gloom. But how true is that? Do we really treat the rain like the bishop in Caddyshack golfing the round of his life? Or do rainy days send Seattleites running for the relative comfort of cars and busses?

    To answer this question, we can merge the bicycle counter data with weather data. I used NOAA Quality Controlled Local Climatological Data from Boeing Field, to record temperature and precipitation corresponding to the observed times in the bicycle data. Being from Boeing Field, the weather data probably aren’t a perfect match for Fremont, but for the purposes of this exploration should be plenty similar. (The website at seattle.gov has more detailed weather data from the University of Washington plugged into a Tableau interface. I had QCLCD data readily available, so that’s what I used. The UW weather recorded more elaborate measurements, like Solar Watts/m2 and wind speed, but I assume that season, temperature, and rain encapsulate most of the variability explained by the more nuanced weather information. If somebody was paying me for this I would spend the time to secure the more detailed data.)

    Fremont_Bike-rain1 (more…)

    — Advertisement —
  • A statistical analysis of biking on the Fremont Bridge, Part 1: Overview

    EDITOR’S NOTE: This is the first in a four-part series of posts this week by statistician Mike Logsdon. Mike bikes across the Fremont Bridge every day, and put together this analysis of the bike counter data “mostly for the amusement of friends and coworkers.” I hope you enjoy it as much as I do.

    The Seattle Department of Transportation installed a bicycle counter at the Fremont Bridge on October 2, 2012. The Fremont Bridge is the primary route for bicycle commuters who live in northwest Seattle and work downtown. I’m sure that some brave souls tangle with the gnarly and unsafe Ballard bridge sidewalk, and some adventurous souls cross the Hiram Chittenden Locks, but the Fremont Bridge is by far the most suitable bike crossing for commuters traveling from northwest Seattle to the urban center.

    The city of Seattle has made the hourly bicycle crossing data public, and uploaded it to Seattle’s data webpage. I accessed the Fremont bridge bicycle counter data on May 20, 2014. Note that this data can also be visualized at SDOT through a Tableau interface, if you wish to poke around in it yourself.

    This document discusses the Fremont Bridge bicycle crossing data. First, we present the data, then investigate the following:

    • How much does rain dissuade ridership?
    • Does the Cascade Bicycle Club’s “Bike Month” affect the rate of bicycle commuting?
    • Are Fremont Bridge bicycle trips increasing?

    Overall Ridership

    Fremont_Bike-1 (more…)

    — Advertisement —
  • Seattle Bike Blog Magazine, Issue 10

    IMG_0162

    Seattle Bike Blog Magazine, Issue #10

    I am bike camping in the San Juan Islands this week, so the blog will be a bit less active than usual. But I’ve got some good stuff queued up, including some cool analysis of the Fremont Bridge bike counter data. So stay tuned, and thanks for reading!

    Seattle Bike Blog Magazine is a touch-screen-optimized recap of some of our recent posts on this blog. So if you read everything on the blog, don’t expect to find any new content. But for those of you who like to kick back and get caught up, enjoy.

    Catch archived issues here.

    — Advertisement —
  • The Northgate bike/walk bridge designs are stunning, could be a neighborhood icon

    Concept image of the tube truss option. From SDOT.
    Concept image of the tube truss option. From SDOT.

    So we’ve already established that the Northgate bike/walk bridge is a good idea from a neighborhood connectivity perspective. But another important benefit of the bridge is the chance to create a truly spectacular and maybe even iconic piece of infrastructure for Northgate.

    In a neighborhood known best for its mall, one of the first post-war indoor malls built in the United States, increasing density and changing shopping trends set the stage for a future where Northgate Mall and the light rail station are more of a neighborhood center than merely a driving destination for people who live somewhere else.

    The mall was built next to a freeway that cuts the neighborhood in half, and is surrounded by big surface parking lots. Even after recent remodeling projects, much of the mall area reflects 1950s thinking that does not fit in today’s Seattle.

    Since indoor malls across the nation have been failing, Northgate could be an example of how a mall can stay vibrant and relevant in the 21st Century. Rather than seas of surface parking lots, people want culture and street life. And the bike/walk bridge could be one eye-catching example of the effort.

    The city held an open house recently to show off some design ideas for the bridge and gather feedback. The project still needs to find $15 million, and the city and Sound Transit have applied for a competitive federal TIGER grant to fill the gap. But if they do not receive the grant, they should be developing a backup plan to make sure funding is found before the July 2015 deadline set by Sound Transit. You can let them know you support finding funding for the bridge and give your other thoughts by emailing [email protected].

    Below are some highlights from the city’s presentation on the bridge concepts. (more…)

    — Advertisement —
— Advertisement —

Join the Seattle Bike Blog Supporters

As a supporter, you help power independent bike news in the Seattle area. Please consider supporting the site financially starting at $5 per month:

Latest stories

— Advertisements —

Latest on Mastodon

Loading Mastodon feed…